🎁 Free Forever Plan
Key Features
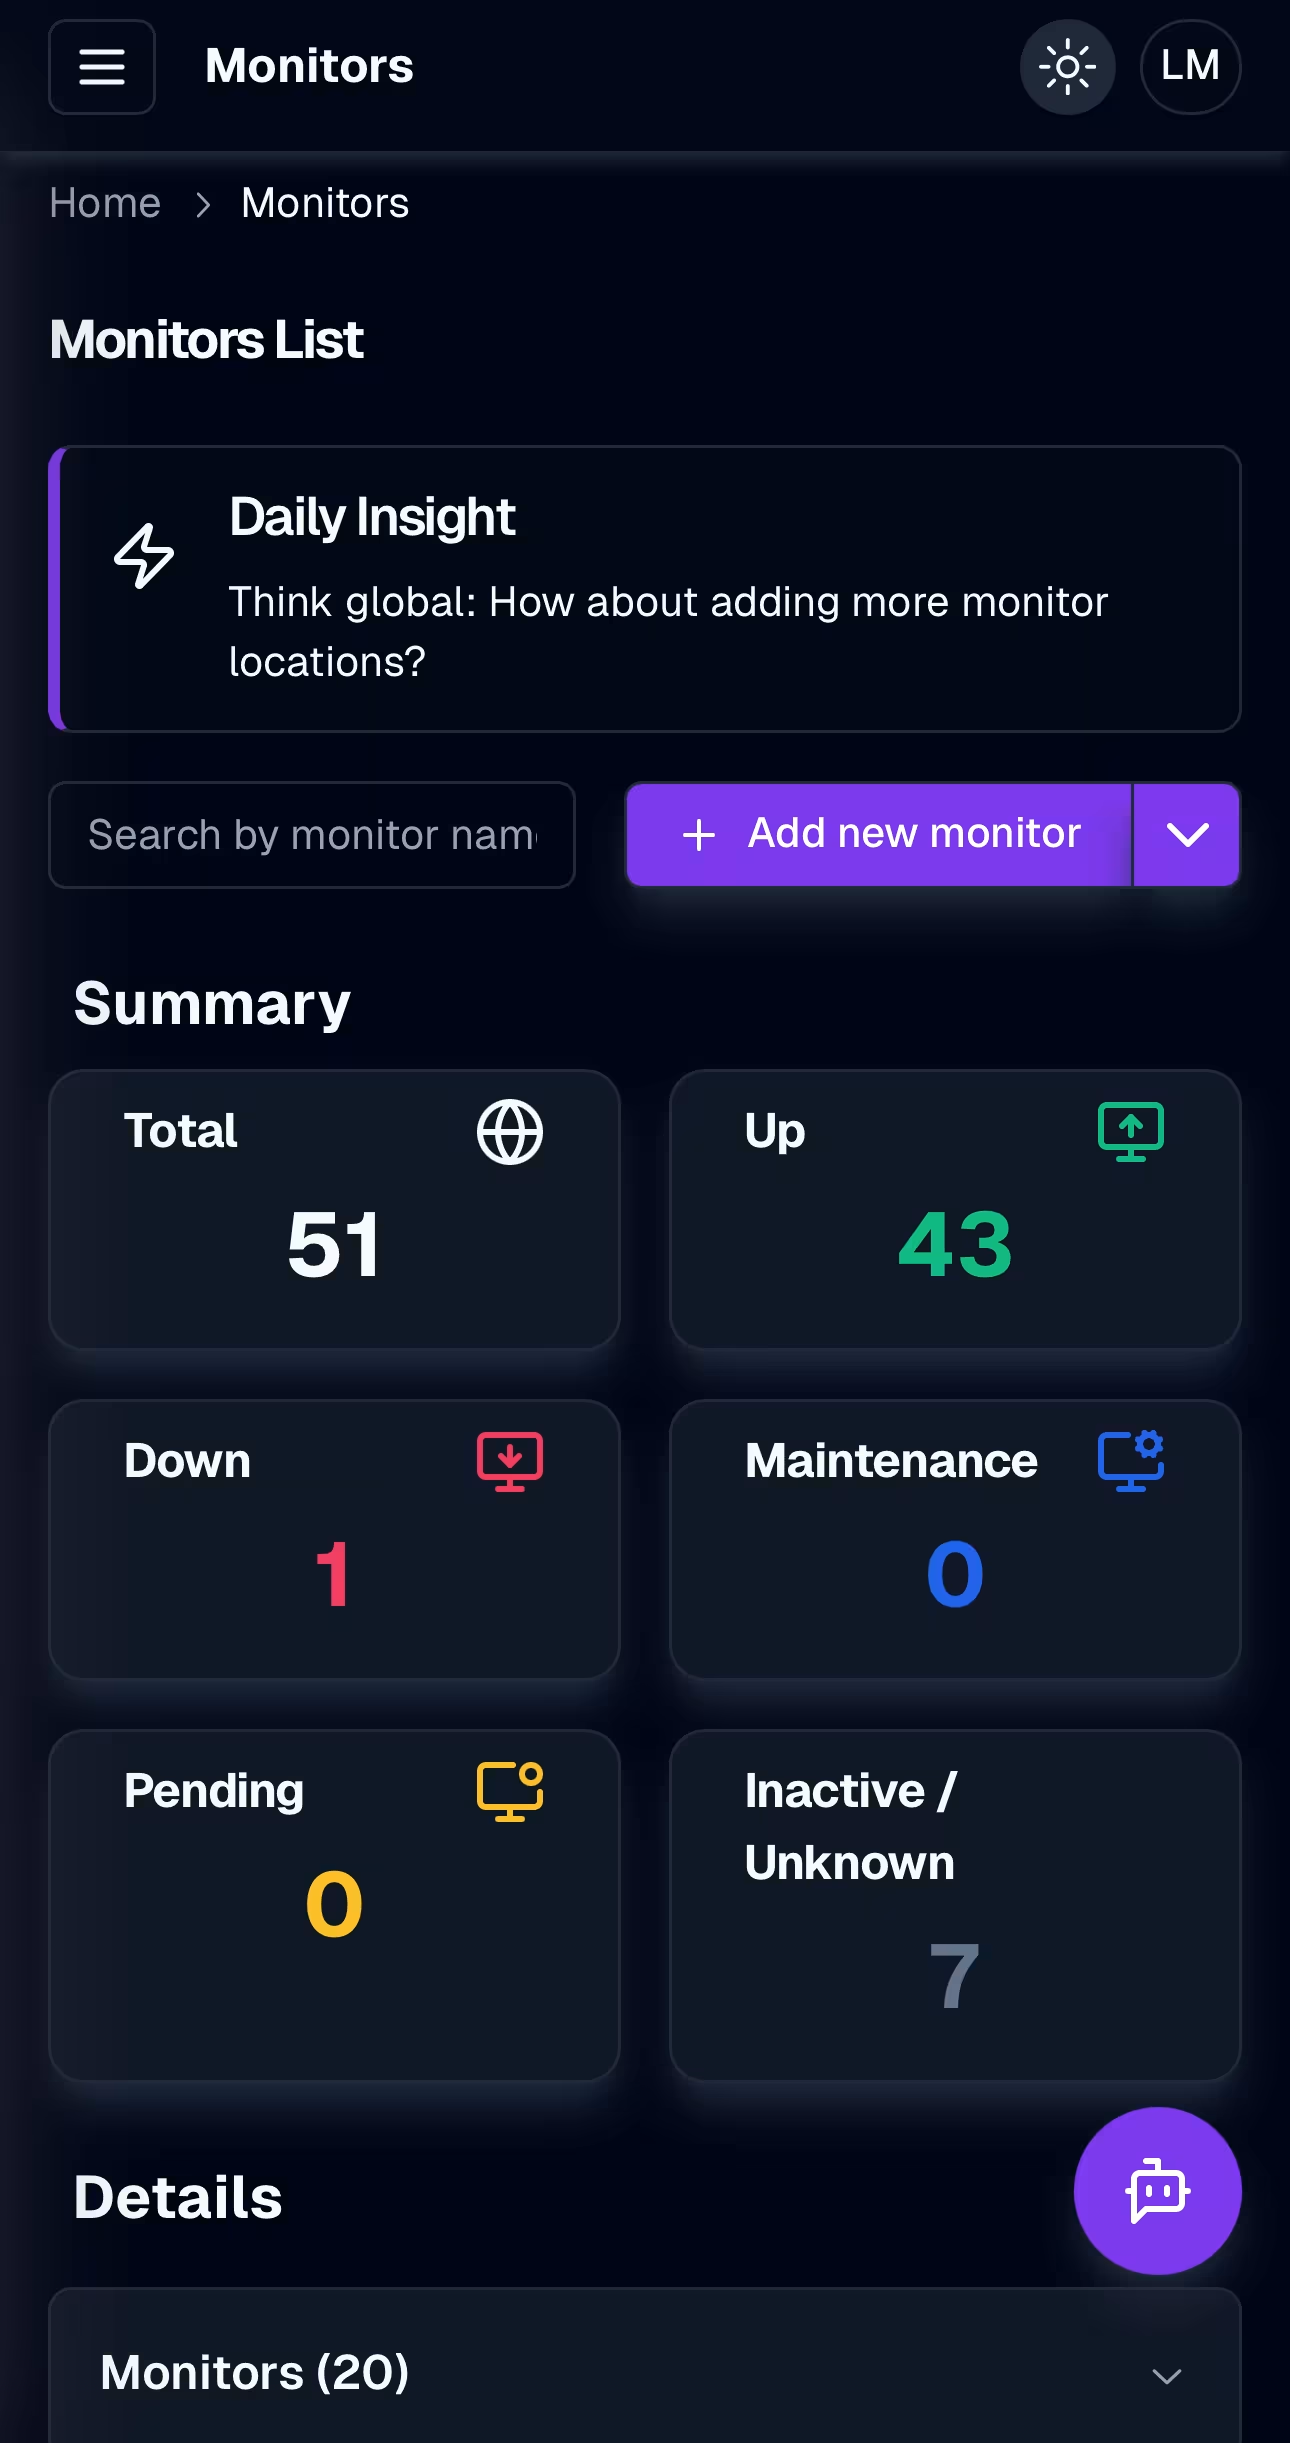
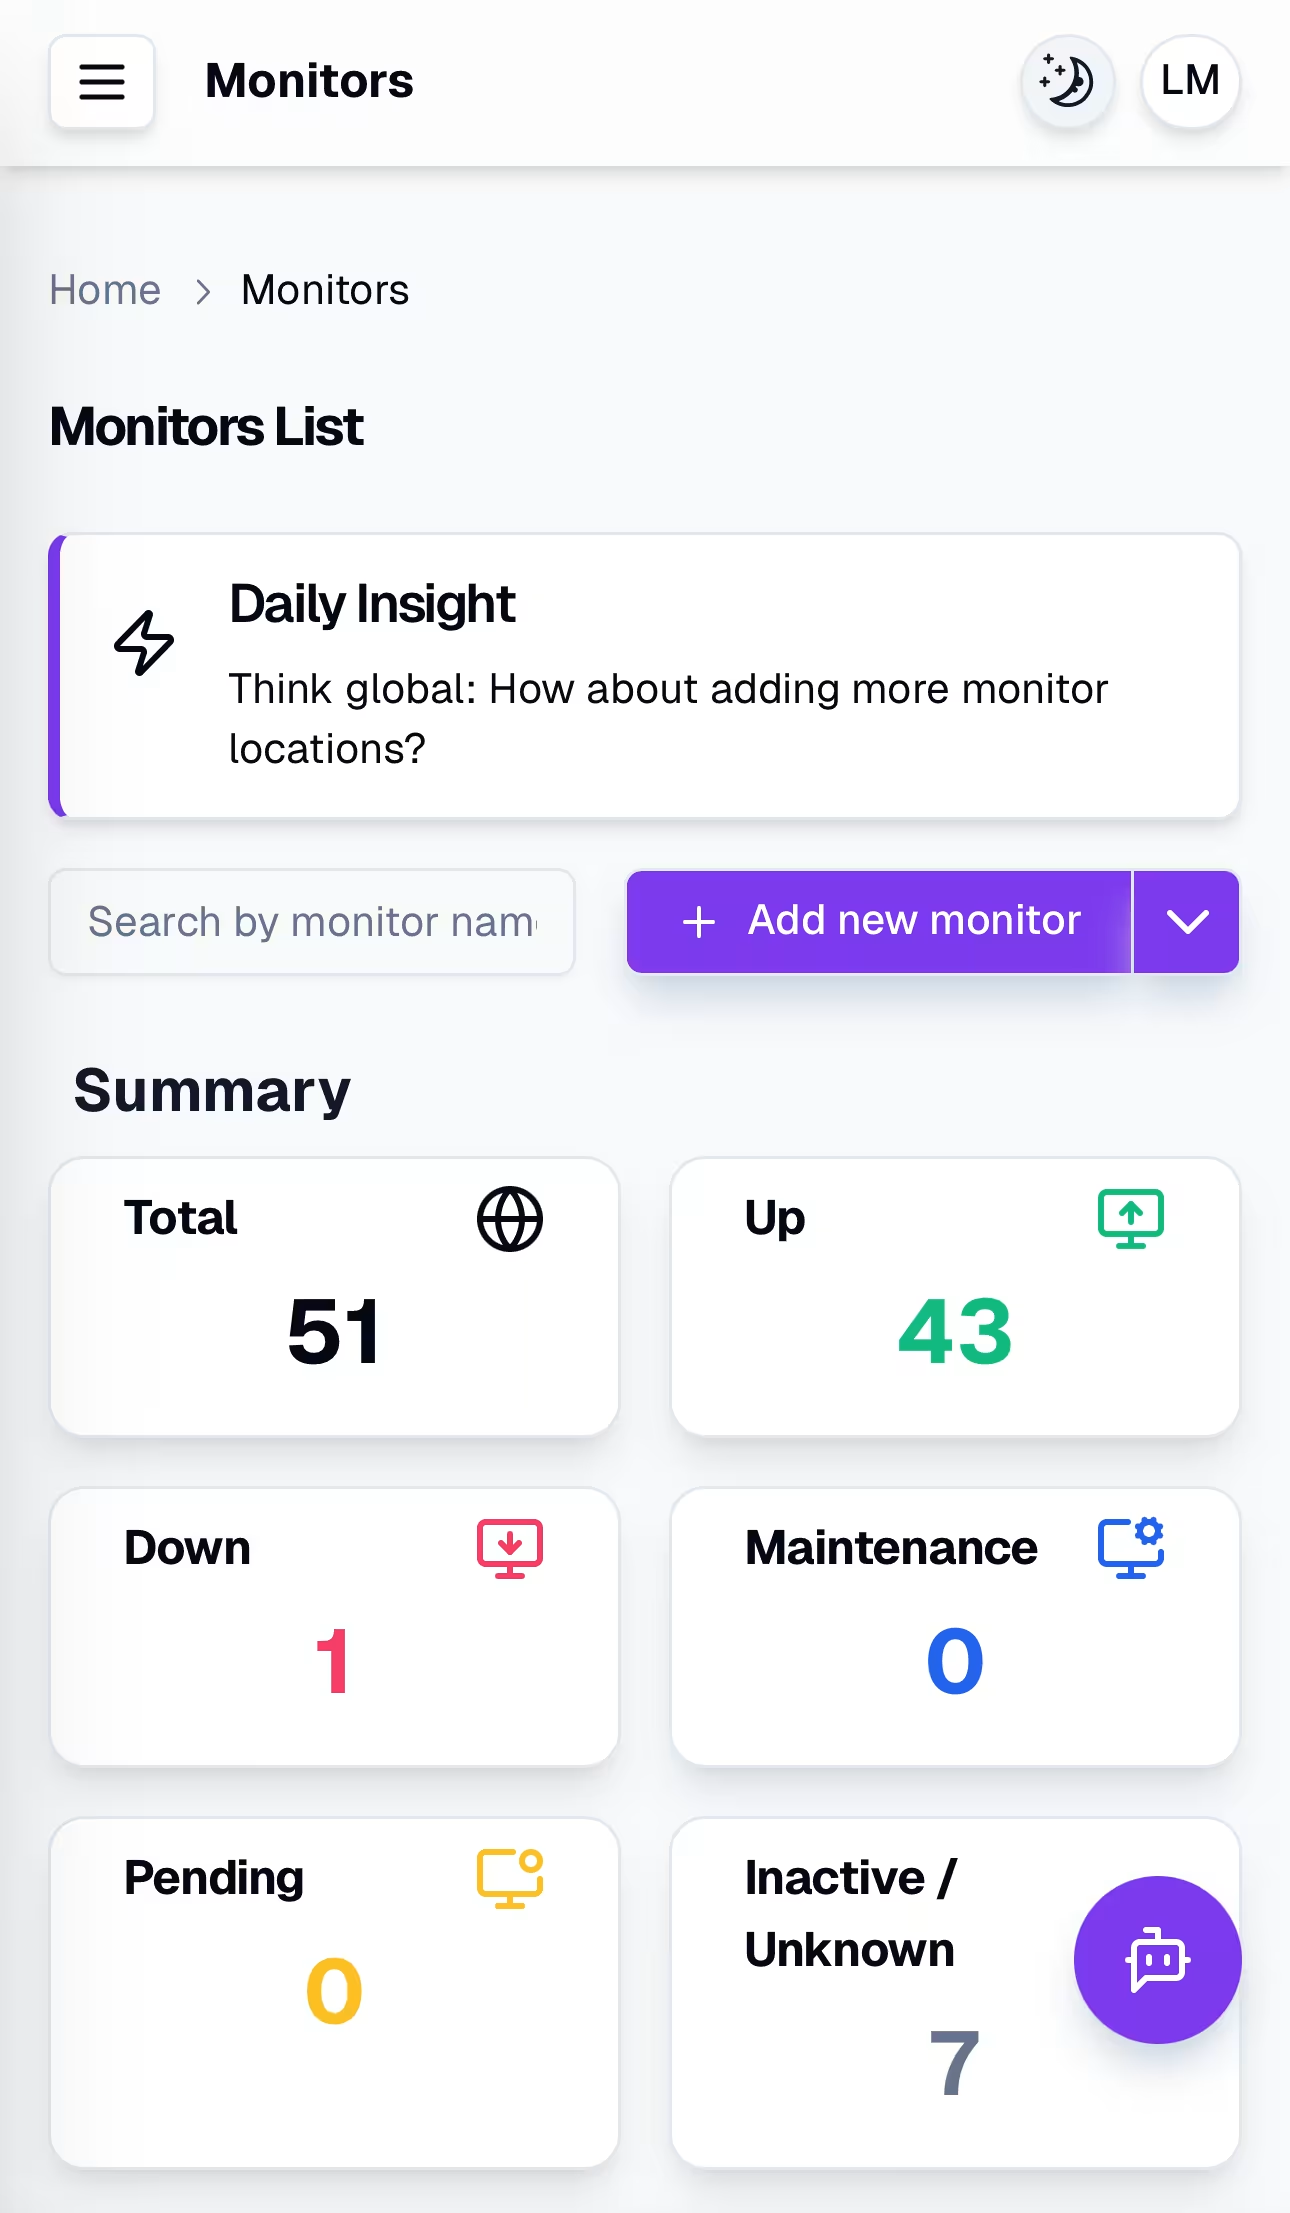
Real-time Metrics
Visualize your services performance with instant updates and dynamic graphs.
Trend Analysis
Identify patterns and trends with detailed historical analysis and customizable reports.
Proactive Monitoring
Detect and resolve issues before they affect your users with predictive alerts.
Complete History
Access the complete history of events and metrics for detailed analysis and audits.
Key Metrics
Monitor essential metrics to keep your services always available
Uptime
Real-time availability percentage of your services
Response Time
Response times from different locations
Active Alerts
Current status of alerts and notifications
SSL Status
SSL certificates status and validity
Dashboard Benefits
Available Widgets
Service Uptime
Global Response Time
Monitor Status
Availability Map
Incident History
SSL Metrics
Lowest Performing Monitors
Flow Reports
Frequently Asked Questions
Everything you need to know about our dashboards and visualization capabilities