The shift from monoliths to distributed architectures — microservices, serverless environments, and event-driven systems — has completely redefined the meaning of “monitoring.” What once involved observing a few servers and basic metrics now requires deep visibility into dynamic, highly decoupled systems that are constantly evolving.
Choosing a monitoring platform was never trivial, but today it has become a strategic decision that directly impacts business stability, operational costs, and the ability to scale without friction. What used to be solved with a couple of dashboards and basic alerts now requires evaluating distributed architectures, end-to-end flows, external dependencies, user experience, and proactive incident prevention.
In an environment where complexity is the norm and downtime has an immediate impact on revenue and reputation, selecting the right platform is not just a technical decision — it is an operational resilience decision.
Modern organizations operate on increasingly complex systems:
- Microservices
- Internal and external APIs
- Event-driven architectures
- Multi-region deployments
- CI/CD pipelines
- Critical flows spanning dozens of components
In this scenario, traditional host-based or isolated metric monitoring is no longer sufficient.
Additionally, the economic context has changed. CTOs and platform leaders are no longer only asking, “How comprehensive is our monitoring?” but also:
- Does cost scale predictably?
- How much configuration and alert tuning effort is required for the model to be useful?
- Does it truly reduce downtime or just generate alerts?
- Does it help prevent incidents or only react to them?
- Does it provide context or just noise?
Choosing the wrong monitoring platform today can lead to:
- Escalating costs due to rigid pricing models
- Alert fatigue that exhausts teams
- Lack of visibility into critical flows
- Incidents detected too late
- Excessive dependence on human expertise to interpret raw data
A modern monitoring platform is not defined by how many metrics it can collect, but by how effectively it helps teams make operational decisions before users feel the impact.
One of the most common mistakes when evaluating monitoring platforms is assuming that “more features” automatically means “better monitoring.”
The real challenge is not collecting metrics, but converting technical signals into actionable decisions.
A strong platform must solidly cover the essentials and, on top of that foundation, provide advanced capabilities that enable organizations to evolve from reactive monitoring to preventive and proactive operations.
A modern platform must clearly answer:
- Is the service available?
- From where?
- With what latency?
Without this baseline visibility, reliability cannot be established.
A monitoring platform must provide clear visibility into:
- Internal and external API latency
- HTTP errors and timeouts
- Critical third-party dependencies
Without API visibility, incidents are detected late and diagnosis becomes slow and costly.
A modern platform must allow teams to:
- Configure clear and specific alerts
- Adjust sensitivity based on context
- Avoid duplicates and false positives
Alerting constantly is not the same as monitoring effectively.
Dashboards must quickly answer:
- What is happening right now?
- Which services are affected?
- What is the potential impact?
It must integrate with:
- Slack
- Microsoft Teams
- PagerDuty
Covering only these essentials leaves organizations trapped in a reactive model with high MTTD (Mean Time To Detect) and excessive human effort spent on incident response.
E2E monitoring validates complete business flows as users experience them.
It answers the most important question:
Can the user complete their goal right now?
Enables teams to:
- Detect regressions
- Identify intermittent errors
- Validate critical APIs
- Confirm system behavior even without real traffic
Instead of asking:
Did it cross the threshold?
It asks:
Is this behavior normal for this system, at this moment?
It enables:
- Detection of progressive degradations
- Identification of unusual behaviors
- Adaptation to seasonality
Enables teams to:
- Compare current vs. historical behavior
- Identify negative trends
- Understand incident context
A modern platform should answer:
- Which flow is affected?
- How many users are impacted?
- Is it tied to revenue or SLAs?
Enables teams to:
- Alert before the issue escalates
- Detect latent risks
- Reduce MTTD and MTTR
Based on static thresholds:
- CPU > 80%
- Latency > 300ms
- Error rate > 5%
Problems:
- Frequent false positives
- Failure to detect subtle degradations
They ask:
- Is this behavior normal in this context?
- Is the trend changing?
- Has this pattern historically preceded an incident?
Result: earlier detection and reduced noise.
Scales by:
- Host
- Agent
- Metric
- Log volume
Aligns with:
- Critical flows
- User experience
- Business impact
Detects:
- Service down
- CPU saturation
- Endpoint not responding
Detects:
- Progressive degradations
- Subtle performance shifts
- Risk patterns
Requires:
- Constant threshold adjustments
- Manual alert review
- Continuous rule refinement
Enables:
- Automatic adaptation
- Less tuning
- Reduced operational fatigue
The monitoring platform you choose defines how your organization responds to failure, growth, and business pressure.
It’s not about monitoring more — it’s about monitoring better.
AI-first platforms represent the natural evolution of monitoring in modern distributed environments. Choosing wisely today can be the difference between operating reactively or building a truly resilient operation.
If you want to optimize your monitoring strategy and move toward real incident prevention, start with UptimeBolt through a free trial and evaluate how a modern platform can transform your operational stability.
How to Choose a Modern Monitoring Platform
The shift from monoliths to distributed architectures — microservices, serverless environments, and event-driven systems — has completely redefined the meaning of “monitoring.” What once involved observing a few servers and basic metrics now requires deep visibility into dynamic, highly decoupled systems that are constantly evolving.
Choosing a monitoring platform was never trivial, but today it has become a strategic decision that directly impacts business stability, operational costs, and the ability to scale without friction. What used to be solved with a couple of dashboards and basic alerts now requires evaluating distributed architectures, end-to-end flows, external dependencies, user experience, and proactive incident prevention.
In an environment where complexity is the norm and downtime has an immediate impact on revenue and reputation, selecting the right platform is not just a technical decision — it is an operational resilience decision.
The New Operational Complexity
Modern organizations operate on increasingly complex systems:
In this scenario, traditional host-based or isolated metric monitoring is no longer sufficient.
Additionally, the economic context has changed. CTOs and platform leaders are no longer only asking, “How comprehensive is our monitoring?” but also:
Choosing the wrong monitoring platform today can lead to:
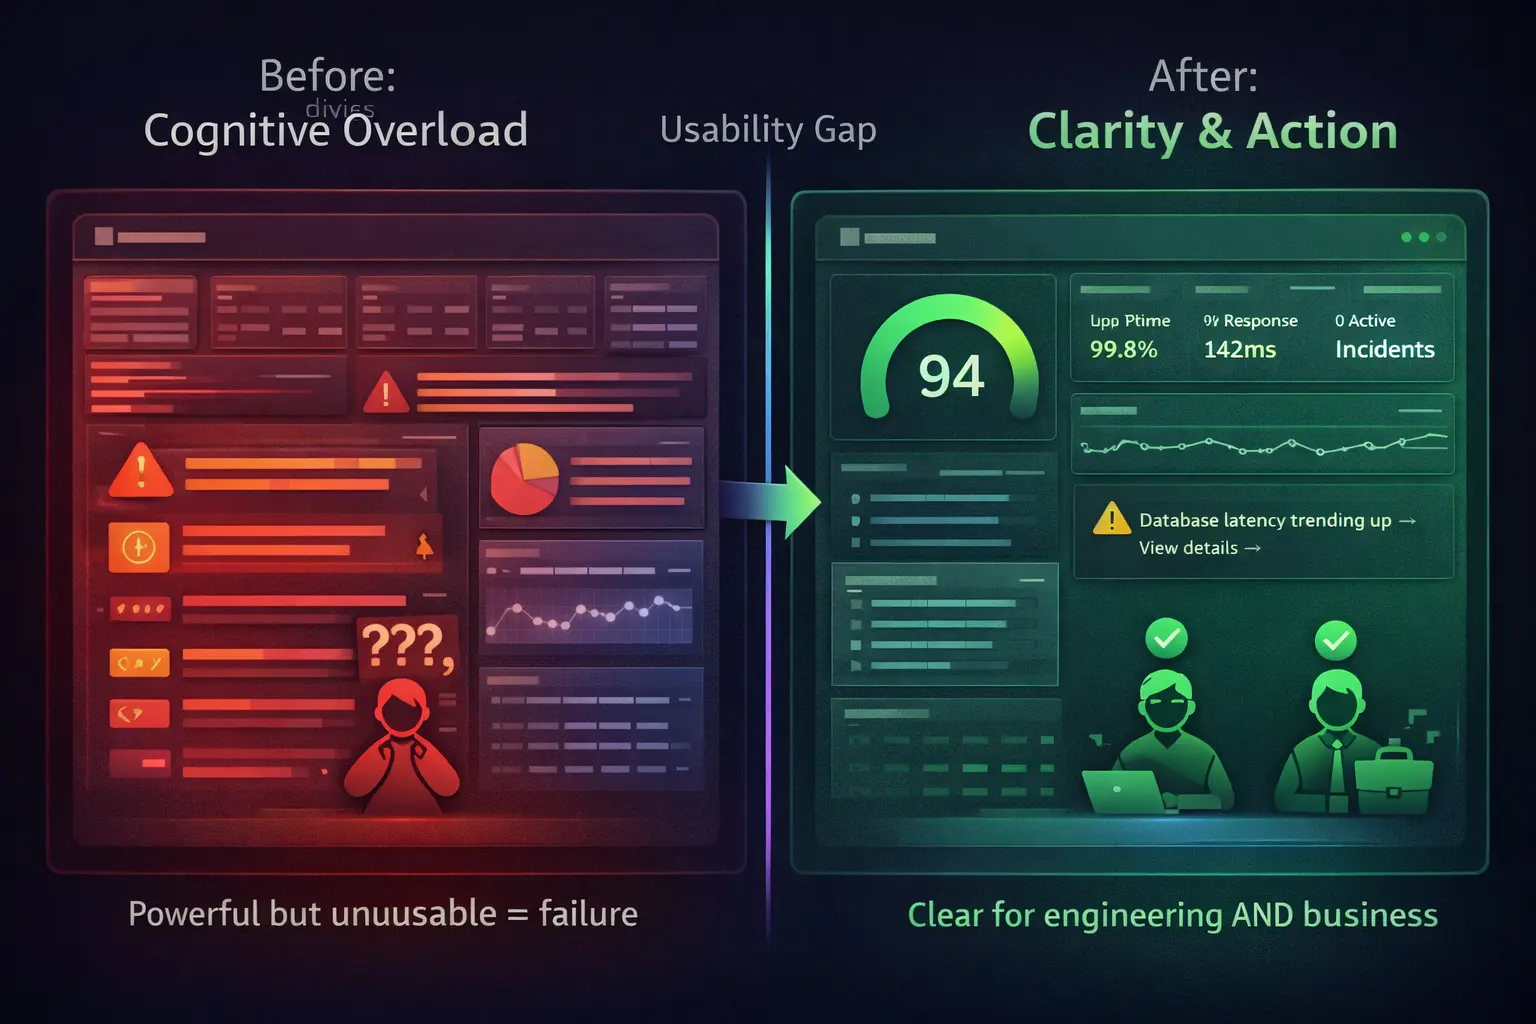
A modern monitoring platform is not defined by how many metrics it can collect, but by how effectively it helps teams make operational decisions before users feel the impact.
What a Modern Monitoring Platform Must Have: Essential vs. Differentiating Capabilities
One of the most common mistakes when evaluating monitoring platforms is assuming that “more features” automatically means “better monitoring.”
The real challenge is not collecting metrics, but converting technical signals into actionable decisions.
A strong platform must solidly cover the essentials and, on top of that foundation, provide advanced capabilities that enable organizations to evolve from reactive monitoring to preventive and proactive operations.
Essential Capabilities: The Non-Negotiable Operational Baseline
Availability and Latency Monitoring
A modern platform must clearly answer:
Without this baseline visibility, reliability cannot be established.
API and Critical Service Visibility
A monitoring platform must provide clear visibility into:
Without API visibility, incidents are detected late and diagnosis becomes slow and costly.
Configurable and Reliable Alerts
A modern platform must allow teams to:
Alerting constantly is not the same as monitoring effectively.
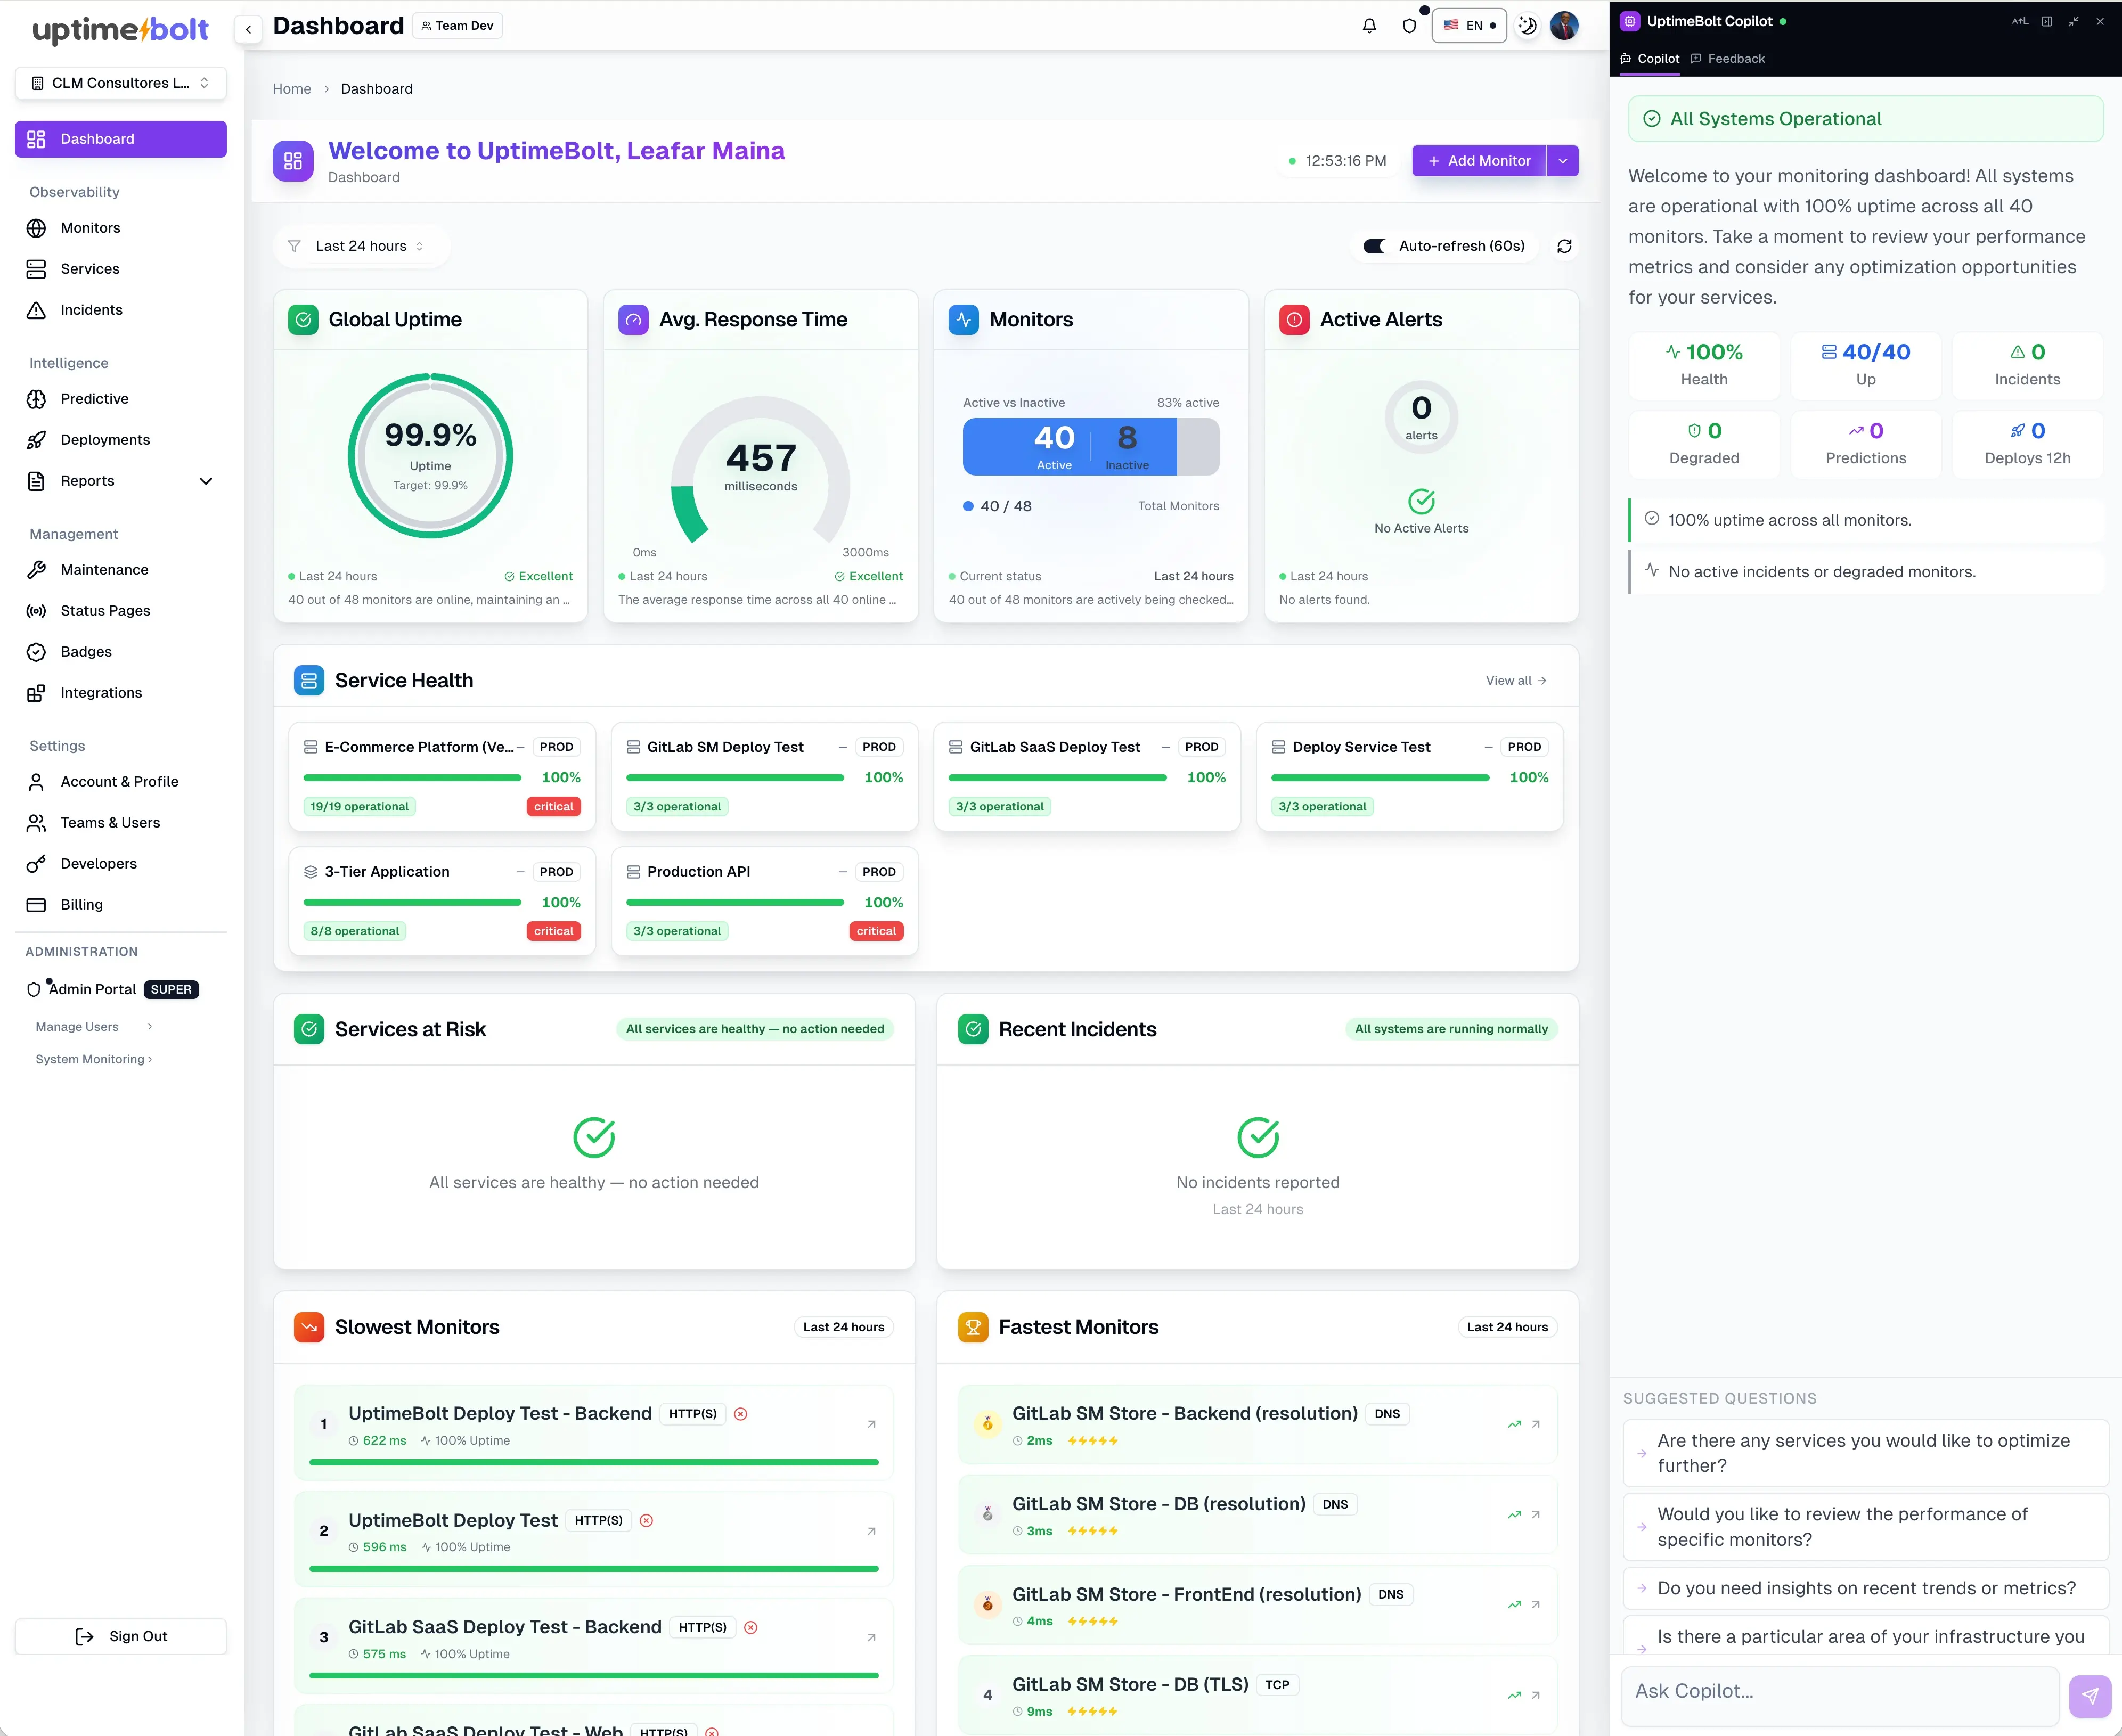
Clear and Actionable Dashboards
Dashboards must quickly answer:
Basic Integrations with Notification Tools
It must integrate with:
Covering only these essentials leaves organizations trapped in a reactive model with high MTTD (Mean Time To Detect) and excessive human effort spent on incident response.
Differentiating Capabilities: The True Maturity Leap
End-to-End (E2E) Monitoring
E2E monitoring validates complete business flows as users experience them.
It answers the most important question:
Continuous Synthetic Monitoring
Enables teams to:
Automatic Anomaly Detection
Instead of asking:
It asks:
It enables:
Historical Behavior Analysis
Enables teams to:
Context for Incident Prioritization
A modern platform should answer:
Early Incident Prediction
Enables teams to:
Legacy Tools vs. AI-First Platforms
1. Detection Model
Legacy Tools
Based on static thresholds:
Problems:
AI-First Platforms
They ask:
Result: earlier detection and reduced noise.
2. Cost Model
Legacy
Scales by:
AI-First
Aligns with:
3. Type of Problem Solved
Legacy
Detects:
AI-First
Detects:
4. Maintenance Effort
Legacy
Requires:
AI-First
Enables:
Conclusion
The monitoring platform you choose defines how your organization responds to failure, growth, and business pressure.
It’s not about monitoring more — it’s about monitoring better.
AI-first platforms represent the natural evolution of monitoring in modern distributed environments. Choosing wisely today can be the difference between operating reactively or building a truly resilient operation.
If you want to optimize your monitoring strategy and move toward real incident prevention, start with UptimeBolt through a free trial and evaluate how a modern platform can transform your operational stability.