Database monitoring is crucial for maintaining application reliability and performance. Whether you're running PostgreSQL, MySQL, MongoDB, or any other database system, proper monitoring can prevent costly downtime and performance issues.
 Your database is the heart of your application. Even a few seconds of downtime can result in lost revenue, frustrated users, and damaged reputation. In 2025, users expect instant responses and zero downtime.
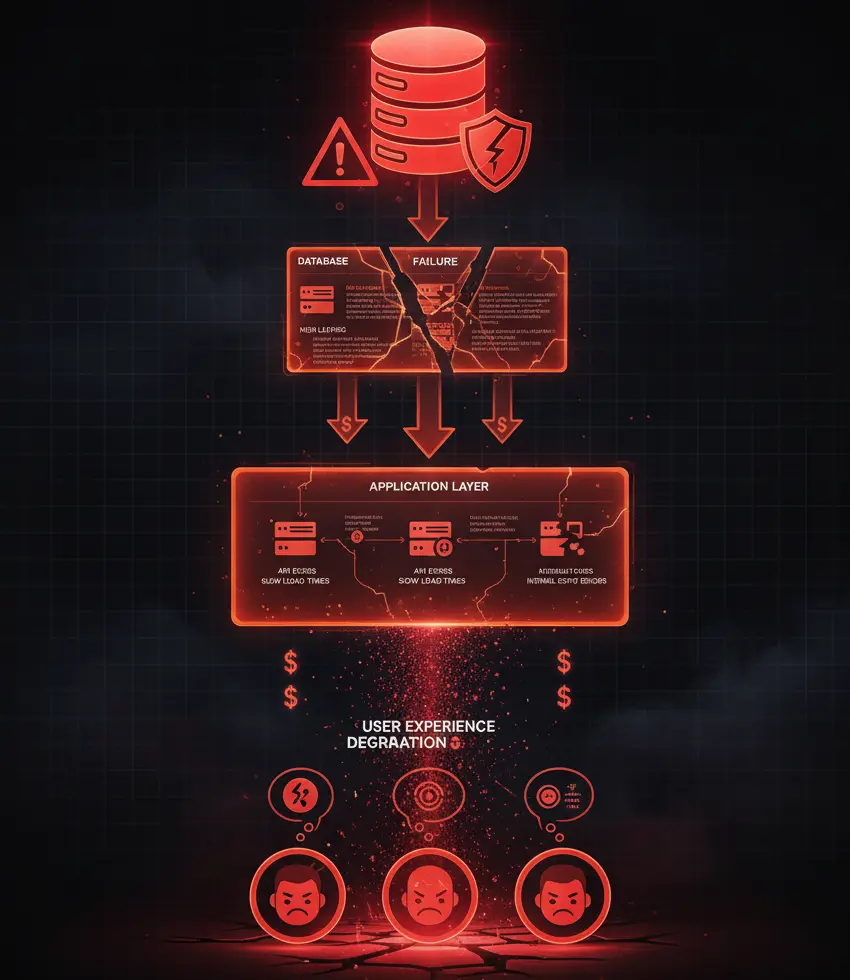
Database issues often cascade into application-wide problems. A slow query can bring down your entire service. Connection pool exhaustion can lock out legitimate users. That's why proactive monitoring is essential.
Monitor query execution time to identify slow queries before they impact users. Set baseline performance metrics and alert when queries exceed acceptable thresholds.
Track active connections, idle connections, and connection wait times. High connection usage can indicate inefficient queries or connection leaks.
Monitor database size, table sizes, and index sizes. Unexpected growth can indicate data issues or missing cleanup jobs.
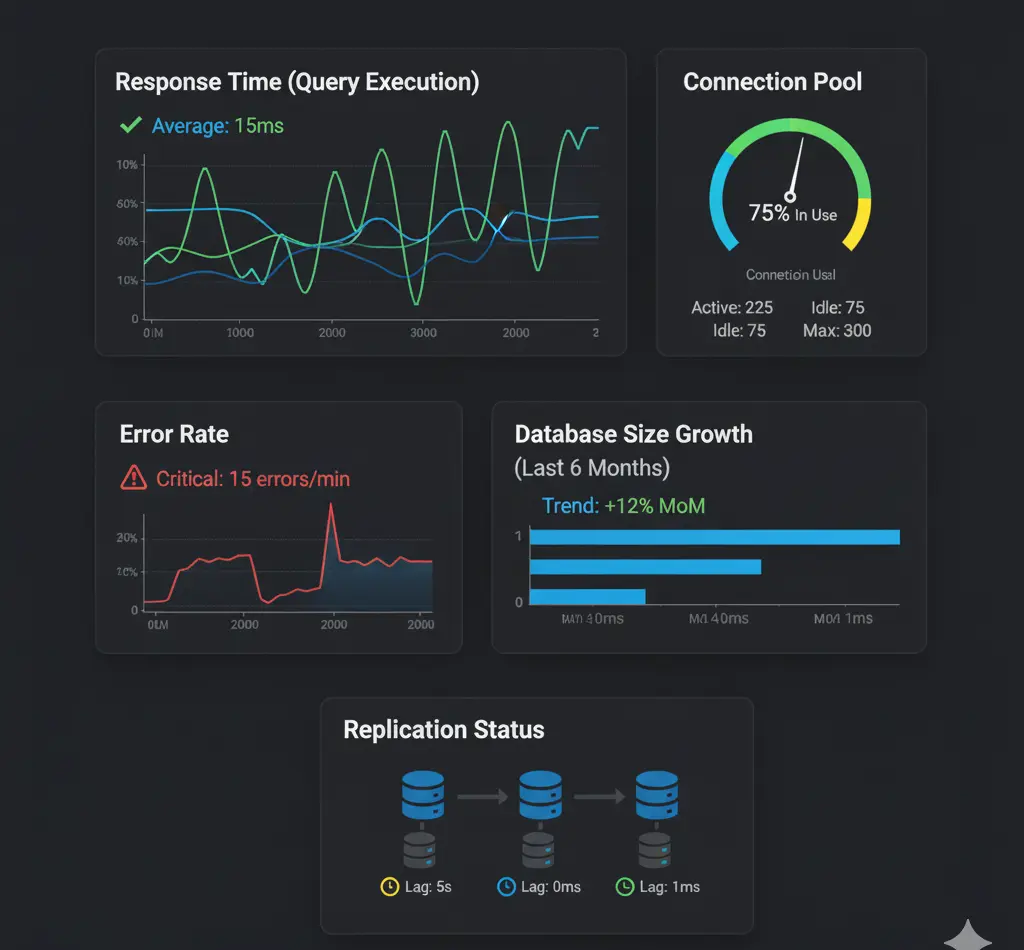
For replicated databases, monitor the lag between primary and replica nodes. High replication lag can cause data inconsistency issues.
Track failed queries, connection errors, and deadlocks. Sudden spikes often indicate underlying problems.
 Set Up Alerts Strategically
Don't just monitor everything - focus on metrics that matter. Configure multi-level alerts: warning thresholds for potential issues and critical alerts for immediate problems.
Set Up Alerts Strategically
Don't just monitor everything - focus on metrics that matter. Configure multi-level alerts: warning thresholds for potential issues and critical alerts for immediate problems.
Test Your Backup Strategy
Regular backups are useless if you can't restore from them. Test your backup and recovery procedures regularly to ensure they work when needed.
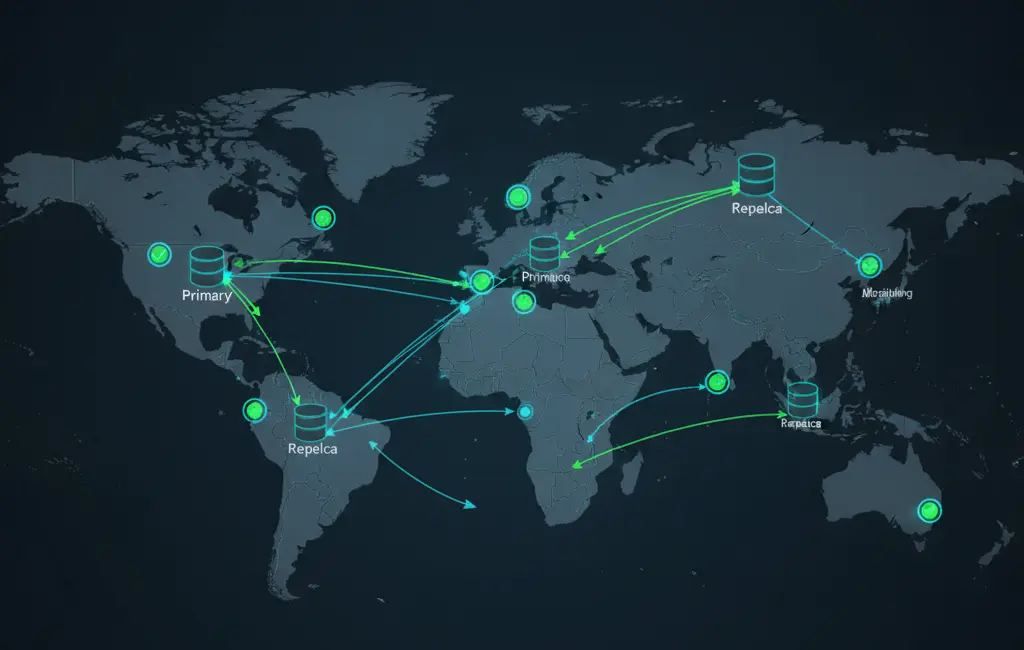
Monitor from Multiple Locations
Use distributed monitoring to catch regional issues and ensure global availability of your database endpoints.
Establish Performance Baselines
Understanding normal behavior makes it easier to spot anomalies. Track performance patterns over time to identify trends.
Automate Responses
For common issues like connection pool exhaustion, implement automatic remediation scripts that can restart services or scale resources.
Don't wait until production to set up monitoring. Implement it in staging environments first to catch configuration issues early.
Avoid alert fatigue by tuning your thresholds. Too many false positives will train your team to ignore notifications.
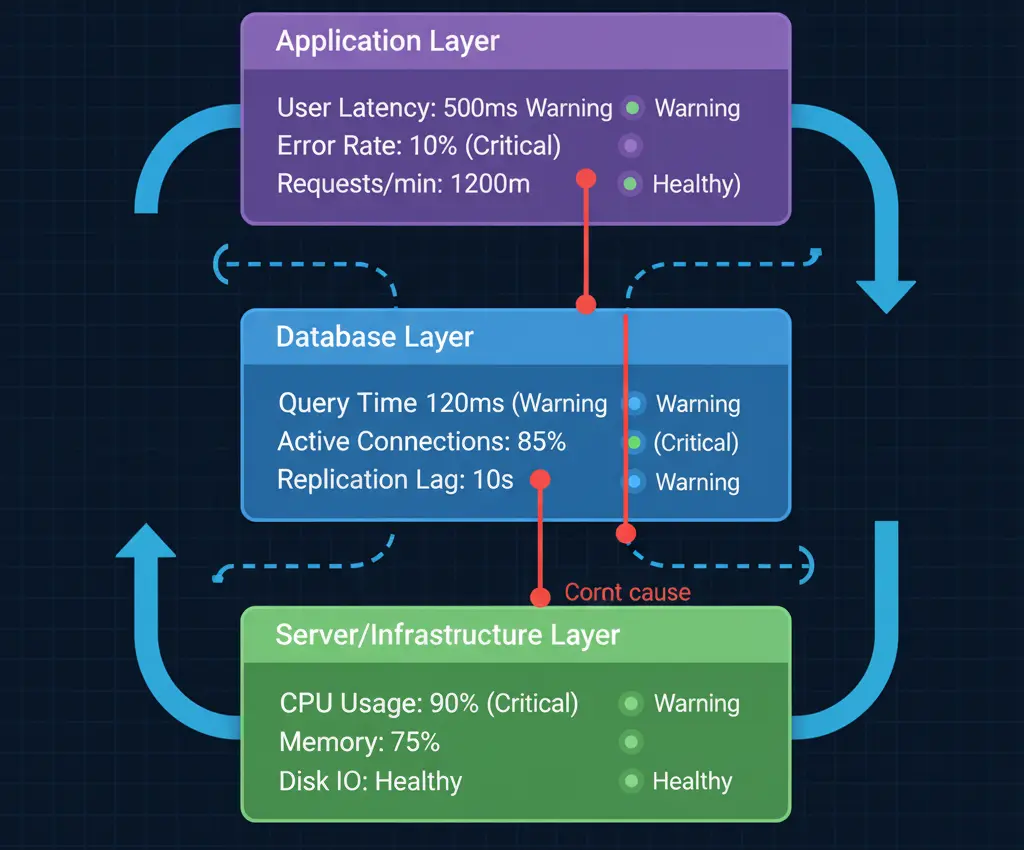
Never monitor databases in isolation. Correlate database metrics with application performance, server resources, and network conditions for complete visibility.
Start with the basics: response time, error rates, and connection counts. Once these are stable, expand to more advanced metrics like query performance analysis and resource utilization.
 Use a dedicated monitoring tool rather than building your own. Modern solutions like UptimeBolt provide specialized database monitoring with minimal setup.
Remember: the best time to implement database monitoring was yesterday. The second best time is now.
Database monitoring is crucial for maintaining application reliability and performance. Whether you're running PostgreSQL, MySQL, MongoDB, or any other database system, proper monitoring can prevent costly downtime and performance issues.
Why Database Monitoring Matters
Database issues often cascade into application-wide problems. A slow query can bring down your entire service. Connection pool exhaustion can lock out legitimate users. That's why proactive monitoring is essential.
Key Metrics to Monitor
Response Time
Monitor query execution time to identify slow queries before they impact users. Set baseline performance metrics and alert when queries exceed acceptable thresholds.
Connection Pool Usage
Track active connections, idle connections, and connection wait times. High connection usage can indicate inefficient queries or connection leaks.
Database Size and Growth
Monitor database size, table sizes, and index sizes. Unexpected growth can indicate data issues or missing cleanup jobs.
Replication Lag
For replicated databases, monitor the lag between primary and replica nodes. High replication lag can cause data inconsistency issues.
Error Rates
Track failed queries, connection errors, and deadlocks. Sudden spikes often indicate underlying problems.
Best Practices
Test Your Backup Strategy Regular backups are useless if you can't restore from them. Test your backup and recovery procedures regularly to ensure they work when needed.
Monitor from Multiple Locations Use distributed monitoring to catch regional issues and ensure global availability of your database endpoints.
Establish Performance Baselines Understanding normal behavior makes it easier to spot anomalies. Track performance patterns over time to identify trends.
Automate Responses For common issues like connection pool exhaustion, implement automatic remediation scripts that can restart services or scale resources.
Common Pitfalls to Avoid
Don't wait until production to set up monitoring. Implement it in staging environments first to catch configuration issues early.
Avoid alert fatigue by tuning your thresholds. Too many false positives will train your team to ignore notifications.
Never monitor databases in isolation. Correlate database metrics with application performance, server resources, and network conditions for complete visibility.
Getting Started
Start with the basics: response time, error rates, and connection counts. Once these are stable, expand to more advanced metrics like query performance analysis and resource utilization. Use a dedicated monitoring tool rather than building your own. Modern solutions like UptimeBolt provide specialized database monitoring with minimal setup.
Remember: the best time to implement database monitoring was yesterday. The second best time is now.