Every log you send to Datadog, New Relic, or Elastic already exists on your server. You pay to generate it. Then you pay again to replicate and index it outside your infrastructure. In 80% of cases, that duplication does not improve your MTTR proportionally to its cost. Here are the real numbers with official pricing verified in March 2026.
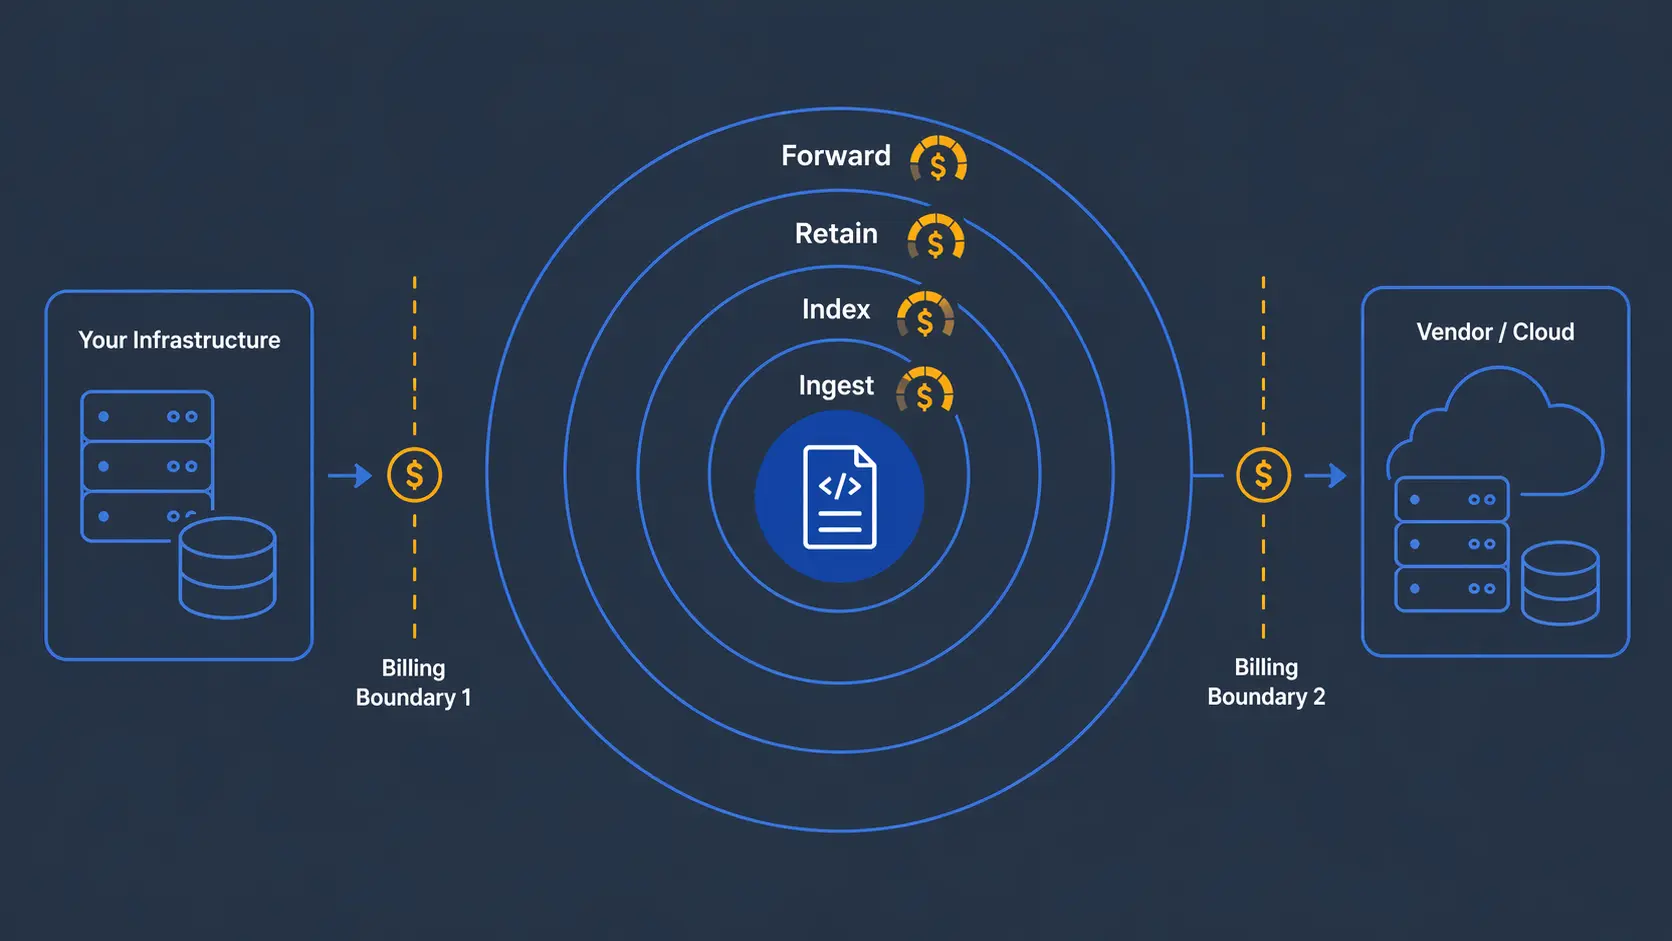
When your application writes a log in production, that log already cost you money: CPU that generated it, disk that stores it, network if it travels inside your VPC. That's your first accounting boundary.
Then you install a Datadog, New Relic, or Elastic agent. The agent takes that same log, compresses it, sends it to the provider. There they ingest it, index it, store it, charge you to run queries on it, charge you to retain it beyond the default, and charge you to forward it if you send it to an external SIEM. That's your second accounting boundary.
The same asset crossed your budget twice.
The classic justification is "I need it to correlate metrics, traces, and logs in one place." It has technical validity, but it assumes something false in most cases: that useful correlation during an incident depends on having 100% of log volume replicated and ready to query. In most real incidents, that premise doesn't hold.
Let's look at a realistic case. B2B SaaS with 25 microservices on Kubernetes, 50 monitored hosts, two environments, team of 15 people (5 need full access for debugging), 100 GB/day of application logs, 99.9% SLA.
Datadog has the particularity of charging twice for logs: once for ingestion ($0.10/GB) and again for indexing ($1.70 per million events). Recent analyses confirm this: "Datadog charges twice for logs. First for ingesting them ($0.10/GB), then for indexing them ($1.70/million events). You can ingest without indexing (they go to archives only), but then you can't search them in the UI — which defeats the purpose for most teams."
For our case (3,000 GB/month of logs):
- Ingestion: ~$300/month
- Indexing: ~$10,200/month
- Infrastructure (50 Pro hosts × $15): $750/month
- APM: ~$1,550/month
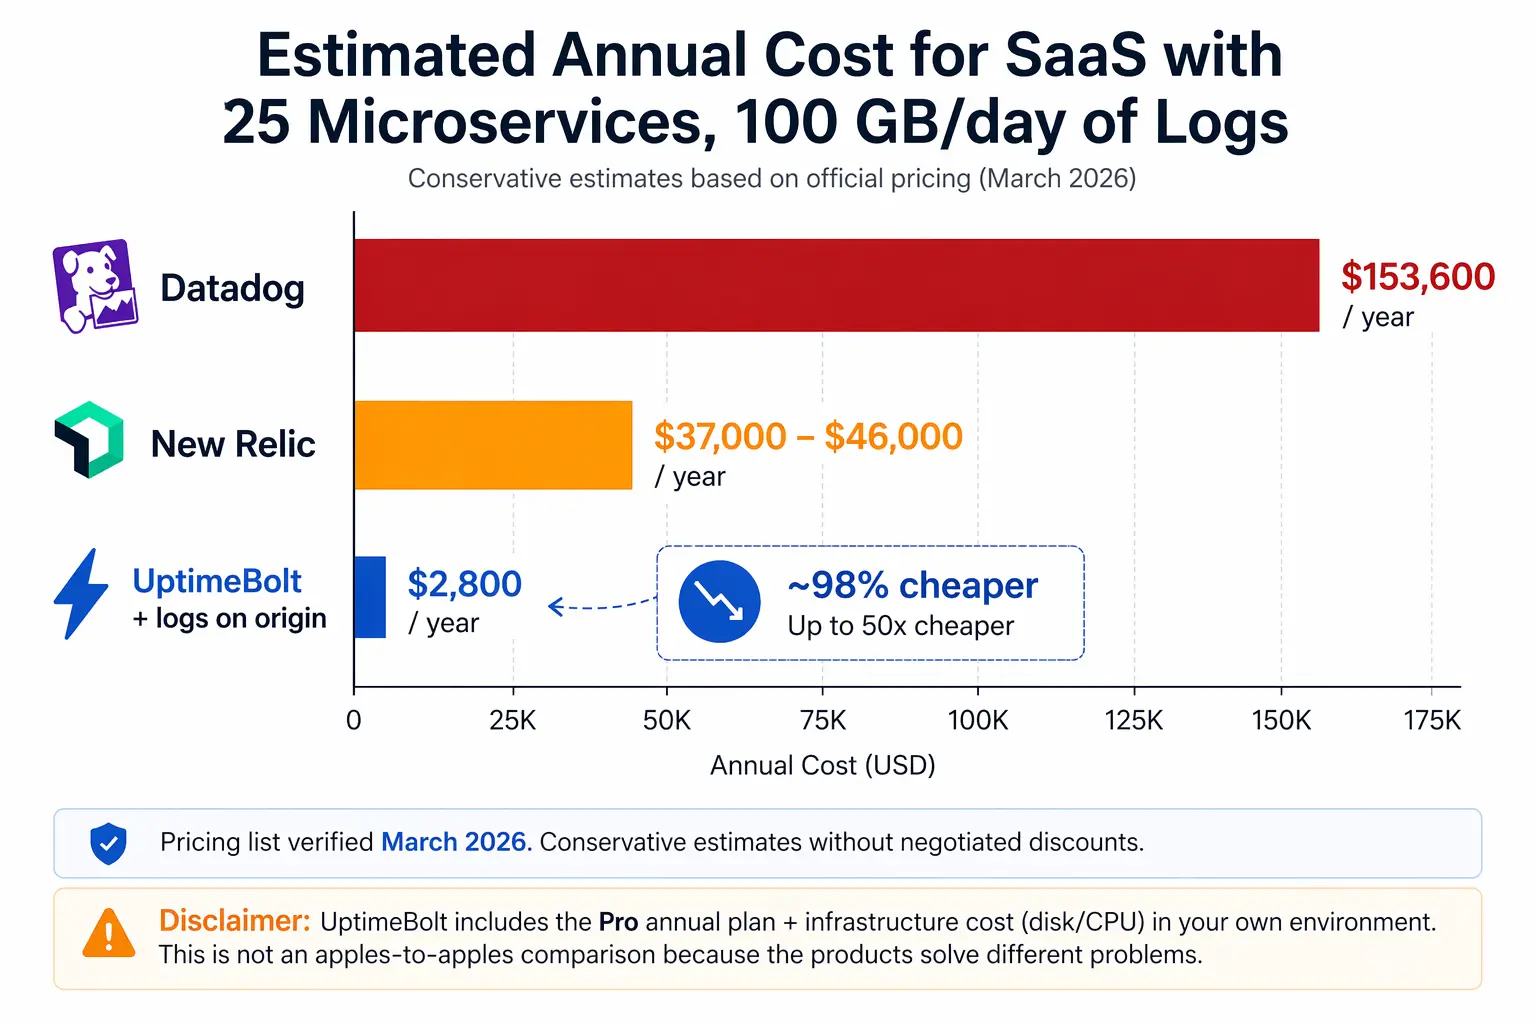
Estimated total: $12,800/month ($153,600/year) — and that's with standard 15-day retention. An independent March 2026 analysis confirms this range: "Your annual Datadog bill at 100 GB/day: approximately $107,400. And this is a conservative estimate. It excludes APM, RUM, synthetic monitoring, security monitoring, and any overages or spikes."
💡 Think that's expensive? Calculate the exact number for your case with
my free Google Sheets calculator → uptimebolt.com/observability-calculator
New Relic charges per full-platform user ($349/user/month on Pro annual) and per GB ingested after the first 100 GB free ($0.40/GB on Original, $0.60/GB on Data Plus with extended retention).
For the same case:
- 5 Pro full-platform users: $1,745/month
- Data ingest (~3,400 GB after free tier): $1,360-2,040/month
Estimated total: $3,100-3,800/month ($37,000-46,000/year)
Important to understand a price cliff: "Standard caps at 5 full platform users. If you have a team of 6+ engineers who need full access, you're forced onto Pro at $349/user. That jump from $406/month (5 users on Standard) to $2,094/month (6 users on Pro) is the sharpest cost cliff in New Relic's pricing."
Notice what you're paying in both cases:
- Ingestion: transporting data you already generated in your infra to the vendor's
- Indexing: making them searchable in the vendor's UI, despite the fact they often already are with
grep or a SQL query to the source
- Retention: storing them in the vendor's infra, despite already storing them in yours
- Forwarding: if you send the same logs to another destination (SIEM, BI), Datadog charges an additional $0.25/GB
The cost structure doesn't reflect technical value. It reflects the number of accounting boundaries crossed by data that was already yours.
For your setup:
Datadog_Cost ≈ (hosts × $15) + (GB_logs_month × $0.10) + (GB_logs_month × 2M × $1.70/M) + (hosts × $31 APM)
The dominant term is almost always log indexing. It grows linearly with your volume and is what explodes when the team does aggressive "structured logging."
And don't forget the origin cost you're already paying: generation CPU (2-7% overhead in apps with aggressive logging), storage disk ($0.04/GB/month on GCP PD), and network egress if logs leave your VPC ($0.09/GB on AWS). In our hypothetical case, that adds $200-400/month extra just to move data you already had.
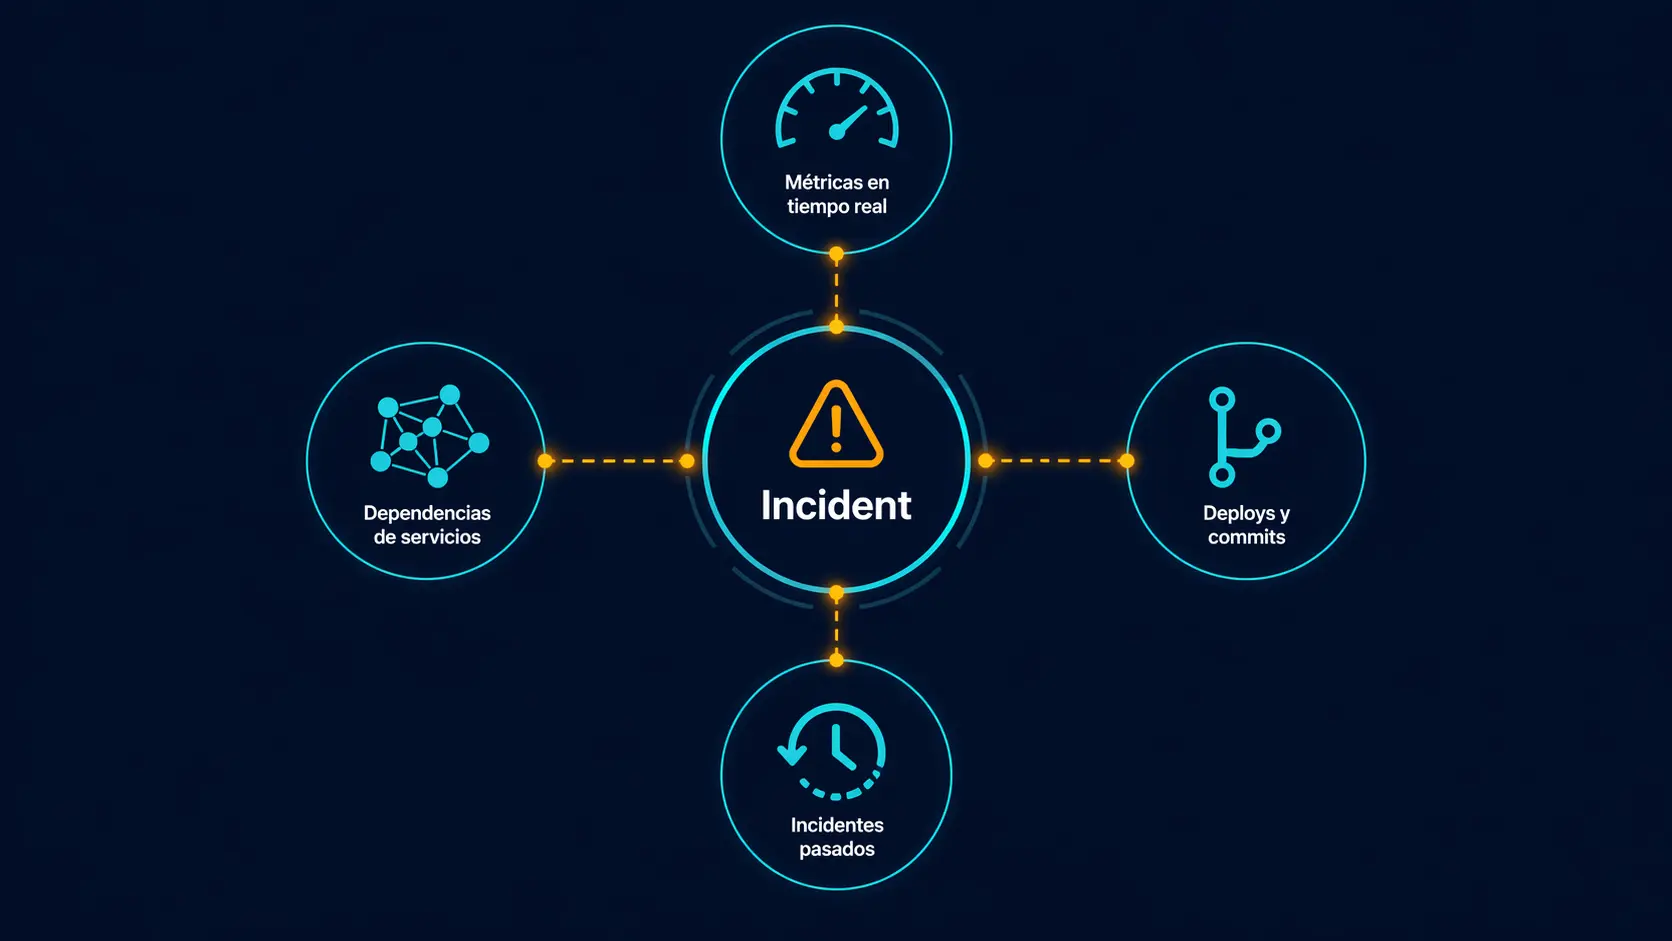 After observing how SRE teams resolve incidents in production, the data that consistently correlates with MTTR reduction is four things:
- Metrics of the affected monitor in the last hour. Not the complete dashboard. The specific monitor that broke.
- Deploys and commits in the prior 2 hours. If something changed in production, it's the first suspect.
- Similar incidents in the last 90 days. If it already happened, the runbook probably exists.
- Dependency graph of the affected service. Without this, blast radius is guesswork.
None of this requires replicating 100% of log volume to an external system. What you do need from logs is granular: logs from the affected service, in the specific incident window, with specific symptom filters. That you can query at origin on-demand, not by replicating them 24/7.
It would be dishonest to say it's never worth it. Three cases where the cost is justified:
Compliance with 7-year retention. HIPAA, PCI-DSS, regulated sectors. The external log manager is the cost of compliance, not of observability.
Security forensics in a SOC. If your team looks for attack patterns with complex queries over long windows, a SIEM with replicated logs is useful.
Microservices with >50 services and critical distributed tracing. If traces between services are the only path to understand a failed request, a complete enterprise APM is the correct tool.
In my experience observing the LATAM market and global SMB, these three cases are less than 20% of teams currently paying that bill.
If your case doesn't fall into those three, you have options more aligned with your real MTTR cost:
Logs at origin + high-signal observability. Keep logs where they already are (server disk, S3, Cloud Storage). Use a platform that detects anomalies from infrastructure metrics and monitors, automatically correlates with deploys, and extracts specific logs only when RCA requests them. That's what we're building at UptimeBolt.
Self-hosted open source for logs. Grafana Loki, VictoriaLogs, or OpenSearch on your own infra. Total control, zero replication, real cost is compute + disk you already pay for.
Hybrid with sampling. Configure the vendor's agent to send only 5-10% sampled logs. Reduce bill by 80-90% and maintain aggregate search. Fine correlation you do with complete logs at origin when needed.
Next time you open your observability invoice, don't ask "how do I optimize this?" Ask first: "when was the last time, in the first 10 minutes of a real incident, I opened the vendor UI and used something I couldn't have gotten from the affected server's logs in 2 minutes with grep or a SQL query to the origin?"
If the honest answer is "almost never," you're paying for peace of mind, not MTTR.
Peace of mind is valid. Just don't confuse it with the real cost of resolving incidents fast. They're two different products.
We don't replicate logs. We detect anomalies in the metrics your monitor already generates. When there's an incident, we automatically correlate with recent deploys via GitHub/GitLab webhooks, search for similar incidents in your history, and analyze the dependency graph.
When RCA needs logs, we extract them from the affected service in the incident window, from its origin. Not replicated. Not stored in our infrastructure. Just-in-time.
That's why the free plan offers real RCA without instrumenting anything, and paid plans start at $23/month on annual.
Want the exact numbers for your setup?
I built a free calculator with all the formulas already done. Plug in your
data and get the estimated cost on Datadog, New Relic, and the origin-first
alternative. Official pricing verified March 2026.
→ uptimebolt.com/observability-calculator
Prices subject to volume discounts and negotiation. Verify on official pages at time of decision.
You're Paying Twice for the Same Logs: The Real Cost Breakdown
TL;DR
Every log you send to Datadog, New Relic, or Elastic already exists on your server. You pay to generate it. Then you pay again to replicate and index it outside your infrastructure. In 80% of cases, that duplication does not improve your MTTR proportionally to its cost. Here are the real numbers with official pricing verified in March 2026.
The structural problem
When your application writes a log in production, that log already cost you money: CPU that generated it, disk that stores it, network if it travels inside your VPC. That's your first accounting boundary.
Then you install a Datadog, New Relic, or Elastic agent. The agent takes that same log, compresses it, sends it to the provider. There they ingest it, index it, store it, charge you to run queries on it, charge you to retain it beyond the default, and charge you to forward it if you send it to an external SIEM. That's your second accounting boundary.
The same asset crossed your budget twice.
The classic justification is "I need it to correlate metrics, traces, and logs in one place." It has technical validity, but it assumes something false in most cases: that useful correlation during an incident depends on having 100% of log volume replicated and ready to query. In most real incidents, that premise doesn't hold.
The calculation with official pricing
Let's look at a realistic case. B2B SaaS with 25 microservices on Kubernetes, 50 monitored hosts, two environments, team of 15 people (5 need full access for debugging), 100 GB/day of application logs, 99.9% SLA.
What Datadog charges
Datadog has the particularity of charging twice for logs: once for ingestion ($0.10/GB) and again for indexing ($1.70 per million events). Recent analyses confirm this: "Datadog charges twice for logs. First for ingesting them ($0.10/GB), then for indexing them ($1.70/million events). You can ingest without indexing (they go to archives only), but then you can't search them in the UI — which defeats the purpose for most teams."
For our case (3,000 GB/month of logs):
Estimated total:
$12,800/month ($153,600/year) — and that's with standard 15-day retention. An independent March 2026 analysis confirms this range: "Your annual Datadog bill at 100 GB/day: approximately $107,400. And this is a conservative estimate. It excludes APM, RUM, synthetic monitoring, security monitoring, and any overages or spikes."💡 Think that's expensive? Calculate the exact number for your case with my free Google Sheets calculator → uptimebolt.com/observability-calculator
What New Relic charges
New Relic charges per full-platform user ($349/user/month on Pro annual) and per GB ingested after the first 100 GB free ($0.40/GB on Original, $0.60/GB on Data Plus with extended retention).
For the same case:
Estimated total:
$3,100-3,800/month ($37,000-46,000/year)Important to understand a price cliff: "Standard caps at 5 full platform users. If you have a team of 6+ engineers who need full access, you're forced onto Pro at $349/user. That jump from $406/month (5 users on Standard) to $2,094/month (6 users on Pro) is the sharpest cost cliff in New Relic's pricing."
Where the double payment lives
Notice what you're paying in both cases:
grepor a SQL query to the sourceThe cost structure doesn't reflect technical value. It reflects the number of accounting boundaries crossed by data that was already yours.
Estimate your own case quickly
For your setup:
The dominant term is almost always log indexing. It grows linearly with your volume and is what explodes when the team does aggressive "structured logging."
And don't forget the origin cost you're already paying: generation CPU (2-7% overhead in apps with aggressive logging), storage disk (
$0.04/GB/month on GCP PD), and network egress if logs leave your VPC ($0.09/GB on AWS). In our hypothetical case, that adds $200-400/month extra just to move data you already had.What actually correlates with MTTR
None of this requires replicating 100% of log volume to an external system. What you do need from logs is granular: logs from the affected service, in the specific incident window, with specific symptom filters. That you can query at origin on-demand, not by replicating them 24/7.
When paying twice does make sense
It would be dishonest to say it's never worth it. Three cases where the cost is justified:
Compliance with 7-year retention. HIPAA, PCI-DSS, regulated sectors. The external log manager is the cost of compliance, not of observability.
Security forensics in a SOC. If your team looks for attack patterns with complex queries over long windows, a SIEM with replicated logs is useful.
Microservices with >50 services and critical distributed tracing. If traces between services are the only path to understand a failed request, a complete enterprise APM is the correct tool.
In my experience observing the LATAM market and global SMB, these three cases are less than 20% of teams currently paying that bill.
The remaining 80%: what to do
If your case doesn't fall into those three, you have options more aligned with your real MTTR cost:
Logs at origin + high-signal observability. Keep logs where they already are (server disk, S3, Cloud Storage). Use a platform that detects anomalies from infrastructure metrics and monitors, automatically correlates with deploys, and extracts specific logs only when RCA requests them. That's what we're building at UptimeBolt.
Self-hosted open source for logs. Grafana Loki, VictoriaLogs, or OpenSearch on your own infra. Total control, zero replication, real cost is compute + disk you already pay for.
Hybrid with sampling. Configure the vendor's agent to send only 5-10% sampled logs. Reduce bill by 80-90% and maintain aggregate search. Fine correlation you do with complete logs at origin when needed.
The honest question
Next time you open your observability invoice, don't ask "how do I optimize this?" Ask first: "when was the last time, in the first 10 minutes of a real incident, I opened the vendor UI and used something I couldn't have gotten from the affected server's logs in 2 minutes with
grepor a SQL query to the origin?"If the honest answer is "almost never," you're paying for peace of mind, not MTTR.
Peace of mind is valid. Just don't confuse it with the real cost of resolving incidents fast. They're two different products.
What we do differently at UptimeBolt
We don't replicate logs. We detect anomalies in the metrics your monitor already generates. When there's an incident, we automatically correlate with recent deploys via GitHub/GitLab webhooks, search for similar incidents in your history, and analyze the dependency graph.
When RCA needs logs, we extract them from the affected service in the incident window, from its origin. Not replicated. Not stored in our infrastructure. Just-in-time.
That's why the free plan offers real RCA without instrumenting anything, and paid plans start at $23/month on annual.
Want the exact numbers for your setup?
I built a free calculator with all the formulas already done. Plug in your data and get the estimated cost on Datadog, New Relic, and the origin-first alternative. Official pricing verified March 2026.
→ uptimebolt.com/observability-calculator
Try the opposite of double payment at uptimebolt.com, or use AITRIAL14 for 14 days of Pro without a credit card.
Sources
Prices subject to volume discounts and negotiation. Verify on official pages at time of decision.