Operating an application in a single cloud is already complex. Operating it across multiple clouds completely changes the rules of the game.
More and more companies distribute components across AWS, GCP, Azure, and other providers for perfectly valid reasons: resilience, cost optimization, compliance, geographic proximity, service specialization, or historical architectural decisions.
The result is a reality many teams know all too well: a platform that no longer lives in a single environment, but instead exists as a mesh of services, regions, APIs, and dependencies spread across multiple clouds.
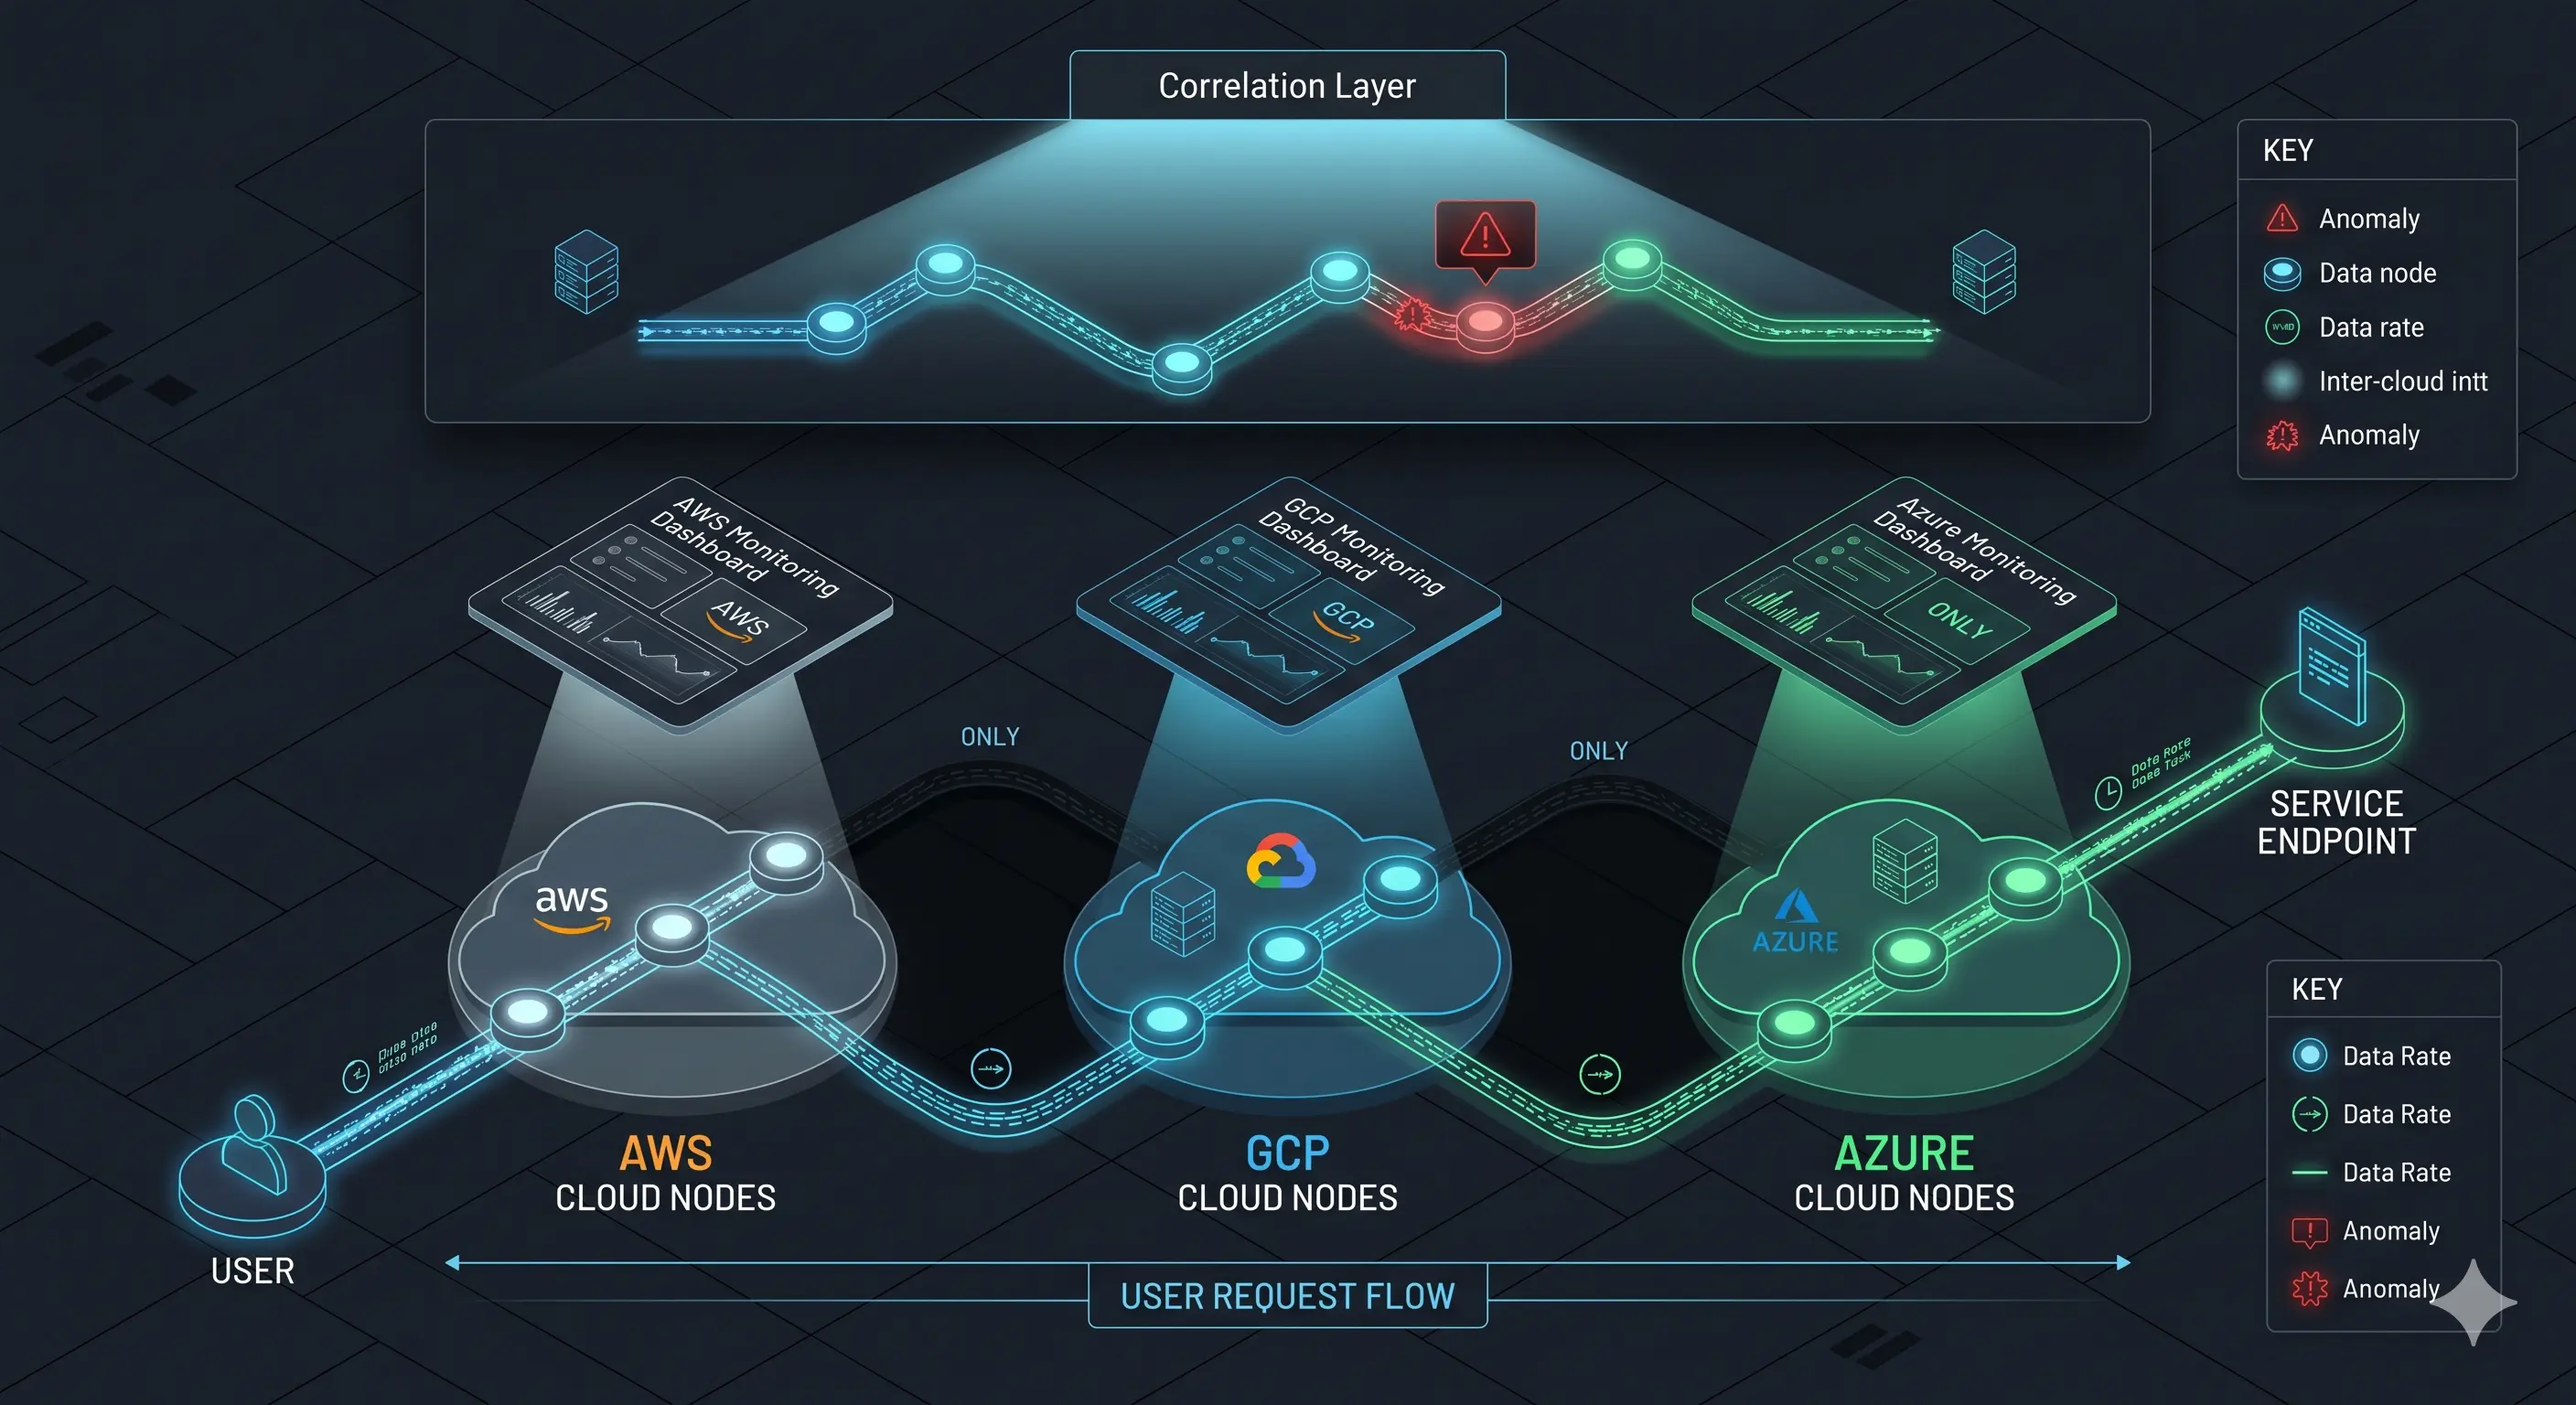
The problem is not only that there are more components. The real issue is that the more distributed a system becomes, the harder it is to understand its behavior as a whole.
A frontend may run in AWS, a critical API in GCP, an analytics layer in Azure, and an external payment gateway outside all of those environments. In that scenario, failures rarely occur “inside” a single component. More often, they happen in the interaction between them.
That distinction is critical.
In multicloud environments, reliability does not depend solely on each individual component being healthy. It depends on the relationships between components remaining fast, consistent, and stable under load.
A service call crossing clouds, an authentication process relying on an external provider, latency differences between regions, or intermittent timeouts in a shared dependency can become a visible incident without any isolated dashboard clearly revealing the problem.
That is why multicloud monitoring cannot be limited to observing components separately. It needs to observe global system behavior.
And this is precisely where predictive monitoring becomes especially valuable: it allows teams to detect anomalies and degradations before they become visible failures for end users.
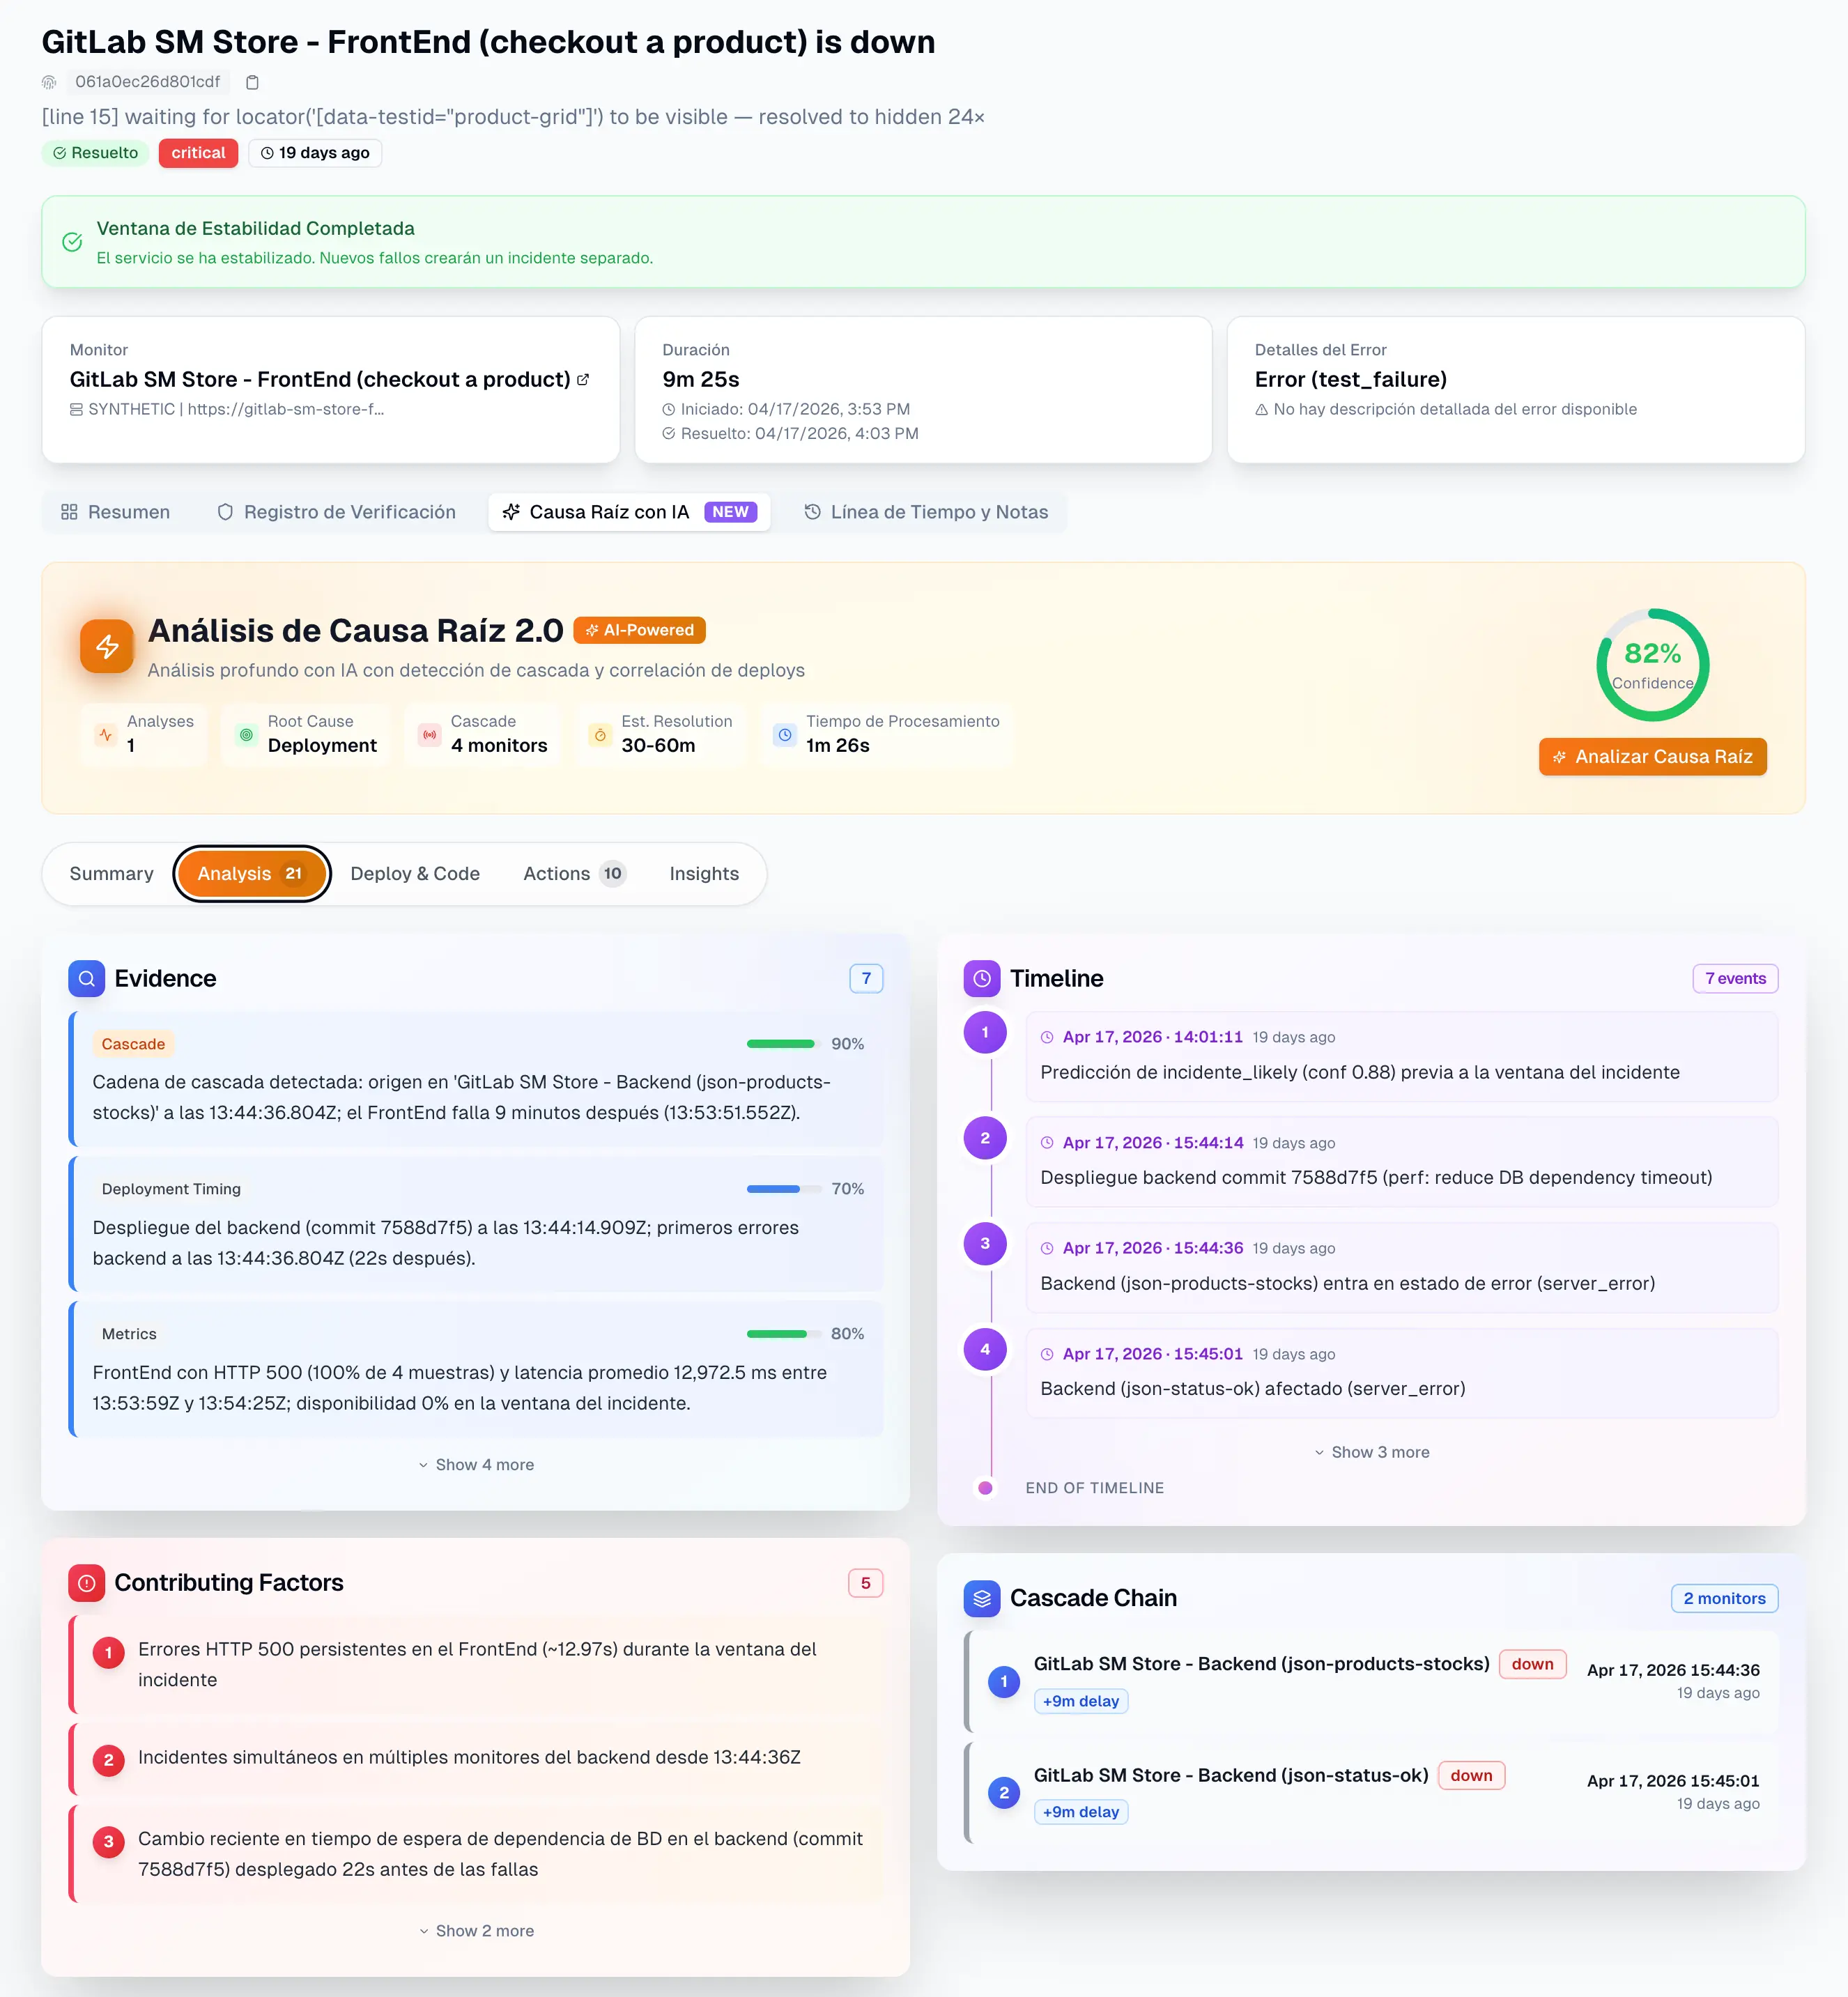
Most traditional monitoring tools were designed to operate within relatively homogeneous environments. Although many tools now offer broader capabilities, the underlying operational logic in many organizations still relies heavily on silos.
- AWS is monitored with AWS dashboards and tools
- GCP is observed through the GCP stack
- Azure is reviewed using Azure-native metrics and events
- External dependencies are treated separately
- Real user flows are fragmented across multiple consoles
This approach has a structural limitation: there is no unified view of the system.
And when the issue originates in the interaction between clouds, that fragmentation becomes extremely expensive.
Each platform only shows “its part” of the incident, but nobody easily sees the complete story.
One team may observe slower API responses in AWS. Another detects timeouts in a GCP service. A third notices increased retries from the frontend. But if nobody correlates those signals as part of the same pattern, diagnosis comes too late.
The outcome is familiar:
- Incidents that are difficult to diagnose
- Longer investigation times
- More war rooms
- Increased dependence on tribal knowledge
- Greater risk that users notice the problem before the team does
Traditional silo-based monitoring also tends to rely heavily on simple thresholds.
That works well for detecting obvious outages or extreme saturation, but it fails when the issue is more subtle:
- gradual degradation between services
- cross-cloud latency worsening only during traffic spikes
- intermittent timeout increases that have not yet crossed a fixed threshold
In multicloud architectures, this subtlety is exactly where the most expensive problems hide.
Predictive monitoring delivers something traditional monitoring rarely achieves on its own: the ability to anticipate changes in the system’s global behavior, not just the status of isolated components.
That fundamentally changes operational logic.
Instead of asking:
“Which service crossed a threshold?”
Predictive monitoring asks:
“Which behavior pattern is changing, and how is it related to the rest of the system?”
That difference matters enormously in multicloud environments, because many incidents do not begin with a visible outage. They begin with small deviations in service interactions.
Predictive monitoring can identify when two services that normally communicate within a specific latency pattern begin to deviate, even if neither service is technically “down.”
It can detect correlations between signals living in different clouds.
For example:
- increased response times in a GCP service
- combined with growing retries from a frontend hosted in AWS
It can flag early deviations before users notice the failure:
- unusual latency variability
- a p95 drifting away from its baseline
- intermittent error patterns
- gradual drops in critical flow success rates
This is the key operational shift:
We move from monitoring components to monitoring global behavior.
And in distributed architectures, global behavior is what truly determines whether the system is healthy.
When a service in AWS depends on another in GCP or Azure, latency between them is not always stable.
It can fluctuate because of:
- saturation
- network changes
- regional pressure
- unexpected behavior under load
Typical example:
An API in AWS calls a risk calculation service in GCP. Under normal traffic, the total response time is acceptable. During a traffic spike, that interaction suddenly becomes 2x or 3x slower, creating a cascade of degradation.
Timeouts are often one of the first symptoms of unstable multicloud interactions.
Initially, they may not be massive. They are often intermittent and difficult to diagnose.
Many multicloud environments also depend on critical third-party services:
- payments
- identity providers
- fraud detection
- logistics
- messaging
- validation systems
A small degradation in one of these dependencies may affect only certain flows, but still create significant business impact.
Two services may continue responding, but with subtle behavioral differences depending on:
- region
- cloud provider
- execution path
This produces issues that do not always appear as outages, but rather as:
- incomplete responses
- anomalous latency
- inconsistent user experiences
A very common multicloud pattern is that the issue does not affect the entire system equally, but rather a specific interaction between:
- one region and another
- one provider and another
This is perhaps the most dangerous case.
No metric crosses a dramatic threshold, but the system slowly enters a risk zone:
- more latency
- more jitter
- more retries
- higher p99 values
Rule-based monitoring often reacts too late. Predictive monitoring can identify the trend early.
Imagine a fairly common architecture:
- Purchase frontend deployed in AWS
- Payment engine running in GCP
- Orders database hosted in AWS
- External fraud validation service outside both providers
During a traffic spike, behavior begins to change.
The frontend still loads.
The main API still responds.
There is no total outage.
But the payment flow starts showing the following symptoms:
- Latency between the frontend and payment service increases 3x
- Intermittent timeouts appear in fraud validation
- The p95 for the “Confirm Payment” step rises from 1.1 s to 3.4 s
- Checkout success rates begin to decline gradually
- AWS: frontend and database appear “healthy”
- GCP: payment service under heavier load, but still available
- External dependency: limited visibility
Result:
Nobody detects a clear issue early on.
- abnormal cross-cloud latency increases
- functional degradation in the payment flow
- signals consistent with an incident forming
That difference between:
“We do not see a clear problem”
and
“We see an anomalous interaction pattern”
is the real operational advantage.
This translates into alerts based on:
- end-to-end latency SLOs
- outlier detection
- critical journey degradation
instead of relying only on CPU or disk alerts.
Multicloud monitoring is not just about technical reliability. It also impacts financial and architectural efficiency.
One of the least visible costs is inter-cloud egress traffic.
When services distributed across providers exchange large amounts of data or increase retries during degradations, transfer costs can rise rapidly.
Considering that egress traffic may cost approximately:
:contentReference[oaicite:0]{index=0}
a functional degradation can quickly multiply those costs by 5x or even 10x because of:
- unnecessary retries
- redundant synchronization
- repeated data transfers
Failures and retries also create a double cost:
- higher resource consumption
- longer incident duration
- additional pressure on already stressed services
- increased infrastructure expenses
Additional hidden costs include:
- more investigation time
- prolonged war rooms
- operational productivity loss
- support overhead
- reputational damage
The important insight for leadership is this:
Technical issues in multicloud environments quickly become real operational costs.
That is why visibility is not a luxury. It is an efficiency tool.
This is an important architectural decision.
Native cloud tools offer clear advantages:
- deep integration with provider services
- detailed infrastructure metrics
- natural access to provider events
- excellent diagnostics inside that environment
But their major limitation is obvious:
Their visibility is strongest inside their own cloud.
When systems depend on multiple providers, cloud-native tools create blind spots between clouds.
Each platform shows its own world very well, but not necessarily the interactions connecting it to the rest of the system.
Vendor-agnostic solutions sacrifice some native depth in exchange for something extremely valuable:
cross-cloud visibility.
Their strengths usually include:
- observing global behavior
- monitoring end-to-end journeys
- reducing vendor dependency
- simplifying hybrid and multicloud operations
Their limitation is that they may not always reach the same level of internal detail as deeply integrated provider-native tools.
For CTOs, the decision is not black or white.
It is a balance between:
- local depth
- global visibility
And in multicloud architectures, the second is often far more important than it initially appears.
UptimeBolt does not rely on deep native integrations with every cloud provider to deliver value in multicloud environments.
It does not attempt to become the internal console for AWS, GCP, or Azure.
Its approach is different.
It monitors:
- endpoints
- APIs
- end-to-end flows
- real system behavior
- functional degradations
- anomalous signals emerging between services
This E2E behavior-focused and synthetic monitoring approach allows UptimeBolt to operate as a higher-level global visibility layer that remains cloud-agnostic.
That is its real differentiator:
Visibility from system behavior, not just infrastructure.
In distributed architectures, that makes it possible to detect issues that purely cloud-native perspectives often fragment:
- degradation between services
- failures in critical journeys
- anomalous endpoint behavior
- early warning signals spanning multiple providers
The biggest benefit of predictive monitoring in multicloud environments is not simply “detecting more things.”
It is reducing operational uncertainty.
It achieves this by:
- detecting degradations before visible impact
- identifying critical dependencies at risk
- correlating cross-cloud incidents
- reducing investigation time
- lowering MTTD
- reducing MTTR
In practice, the results usually appear in three dimensions.
Detecting issues earlier enables teams to respond earlier.
That reduces both full outages and windows of functional degradation.
When issues are contained before critical flows collapse, users experience less disruption.
Predictive monitoring does not eliminate multicloud complexity, but it significantly reduces operational uncertainty.
And that matters enormously:
In multicloud, architecture cannot always be simplified. But operations can be improved with better signals.
The more clouds you use, the more interactions exist.
And the more interactions exist, the more potential failure points emerge.
That is the true challenge of multicloud monitoring.
It is not enough to have more dashboards or more data. In fact, more data without context can make the problem worse.
What truly matters is understanding the system’s global behavior and anticipating when an interaction begins to degrade.
That is the key message:
In multicloud environments, reliability depends on understanding interactions and anticipating problems.
More clouds create more risk if visibility remains fragmented.
More signals do not create more control if nobody correlates what matters.
And more tools do not automatically create more resilience if each one only observes a small part of the system.
That is why predictive monitoring becomes a critical layer in distributed infrastructures.
Not because it replaces everything else, but because it helps teams see early what traditional monitoring usually understands too late.

The Role of Predictive Monitoring in Multicloud Infrastructures
Operating an application in a single cloud is already complex. Operating it across multiple clouds completely changes the rules of the game.
More and more companies distribute components across AWS, GCP, Azure, and other providers for perfectly valid reasons: resilience, cost optimization, compliance, geographic proximity, service specialization, or historical architectural decisions.
The result is a reality many teams know all too well: a platform that no longer lives in a single environment, but instead exists as a mesh of services, regions, APIs, and dependencies spread across multiple clouds.
The Real Challenge: Failures Happen in the Interaction, Not the Component
The problem is not only that there are more components. The real issue is that the more distributed a system becomes, the harder it is to understand its behavior as a whole.
A frontend may run in AWS, a critical API in GCP, an analytics layer in Azure, and an external payment gateway outside all of those environments. In that scenario, failures rarely occur “inside” a single component. More often, they happen in the interaction between them.
That distinction is critical.
In multicloud environments, reliability does not depend solely on each individual component being healthy. It depends on the relationships between components remaining fast, consistent, and stable under load.
A service call crossing clouds, an authentication process relying on an external provider, latency differences between regions, or intermittent timeouts in a shared dependency can become a visible incident without any isolated dashboard clearly revealing the problem.
That is why multicloud monitoring cannot be limited to observing components separately. It needs to observe global system behavior.
And this is precisely where predictive monitoring becomes especially valuable: it allows teams to detect anomalies and degradations before they become visible failures for end users.
Why Traditional Monitoring Fails in Multicloud Environments
Most traditional monitoring tools were designed to operate within relatively homogeneous environments. Although many tools now offer broader capabilities, the underlying operational logic in many organizations still relies heavily on silos.
The Problem with Monitoring Silos
This approach has a structural limitation: there is no unified view of the system.
And when the issue originates in the interaction between clouds, that fragmentation becomes extremely expensive.
Each platform only shows “its part” of the incident, but nobody easily sees the complete story.
One team may observe slower API responses in AWS. Another detects timeouts in a GCP service. A third notices increased retries from the frontend. But if nobody correlates those signals as part of the same pattern, diagnosis comes too late.
The outcome is familiar:
Traditional silo-based monitoring also tends to rely heavily on simple thresholds.
That works well for detecting obvious outages or extreme saturation, but it fails when the issue is more subtle:
In multicloud architectures, this subtlety is exactly where the most expensive problems hide.
What Predictive Monitoring Brings to Multicloud Infrastructures
Predictive monitoring delivers something traditional monitoring rarely achieves on its own: the ability to anticipate changes in the system’s global behavior, not just the status of isolated components.
That fundamentally changes operational logic.
Instead of asking:
Predictive monitoring asks:
That difference matters enormously in multicloud environments, because many incidents do not begin with a visible outage. They begin with small deviations in service interactions.
Anomaly Detection Between Services
Predictive monitoring can identify when two services that normally communicate within a specific latency pattern begin to deviate, even if neither service is technically “down.”
Cross-Cloud Pattern Identification
It can detect correlations between signals living in different clouds.
For example:
Anticipation of Degradations
It can flag early deviations before users notice the failure:
This is the key operational shift:
We move from monitoring components to monitoring global behavior.
And in distributed architectures, global behavior is what truly determines whether the system is healthy.
Typical Warning Signals in Multicloud Environments
Inter-Cloud Latency
When a service in AWS depends on another in GCP or Azure, latency between them is not always stable.
It can fluctuate because of:
Typical example:
An API in AWS calls a risk calculation service in GCP. Under normal traffic, the total response time is acceptable. During a traffic spike, that interaction suddenly becomes 2x or 3x slower, creating a cascade of degradation.
Service Timeouts
Timeouts are often one of the first symptoms of unstable multicloud interactions.
Initially, they may not be massive. They are often intermittent and difficult to diagnose.
Unstable External Dependencies
Many multicloud environments also depend on critical third-party services:
A small degradation in one of these dependencies may affect only certain flows, but still create significant business impact.
Response Inconsistencies
Two services may continue responding, but with subtle behavioral differences depending on:
This produces issues that do not always appear as outages, but rather as:
Regional or Cross-Provider Differences
A very common multicloud pattern is that the issue does not affect the entire system equally, but rather a specific interaction between:
Progressive Degradation
This is perhaps the most dangerous case.
No metric crosses a dramatic threshold, but the system slowly enters a risk zone:
Rule-based monitoring often reacts too late. Predictive monitoring can identify the trend early.
A Realistic Example
Imagine a fairly common architecture:
During a traffic spike, behavior begins to change.
The frontend still loads.
The main API still responds.
There is no total outage.
But the payment flow starts showing the following symptoms:
What Traditional Monitoring Would Show
Result:
Nobody detects a clear issue early on.
What Predictive Monitoring Would Detect
That difference between:
and
is the real operational advantage.
This translates into alerts based on:
instead of relying only on CPU or disk alerts.
Hidden Multicloud Costs Beyond Downtime
Multicloud monitoring is not just about technical reliability. It also impacts financial and architectural efficiency.
One of the least visible costs is inter-cloud egress traffic.
When services distributed across providers exchange large amounts of data or increase retries during degradations, transfer costs can rise rapidly.
Considering that egress traffic may cost approximately:
:contentReference[oaicite:0]{index=0}
a functional degradation can quickly multiply those costs by 5x or even 10x because of:
Failures and retries also create a double cost:
Additional hidden costs include:
The important insight for leadership is this:
That is why visibility is not a luxury. It is an efficiency tool.
Cloud-Native vs Vendor-Agnostic Tools
This is an important architectural decision.
Cloud-Native Tools
Native cloud tools offer clear advantages:
But their major limitation is obvious:
Their visibility is strongest inside their own cloud.
When systems depend on multiple providers, cloud-native tools create blind spots between clouds.
Each platform shows its own world very well, but not necessarily the interactions connecting it to the rest of the system.
Vendor-Agnostic Tools
Vendor-agnostic solutions sacrifice some native depth in exchange for something extremely valuable:
cross-cloud visibility.
Their strengths usually include:
Their limitation is that they may not always reach the same level of internal detail as deeply integrated provider-native tools.
For CTOs, the decision is not black or white.
It is a balance between:
And in multicloud architectures, the second is often far more important than it initially appears.
How UptimeBolt Fits Into Multicloud Environments
UptimeBolt does not rely on deep native integrations with every cloud provider to deliver value in multicloud environments.
It does not attempt to become the internal console for AWS, GCP, or Azure.
Its approach is different.
It monitors:
This E2E behavior-focused and synthetic monitoring approach allows UptimeBolt to operate as a higher-level global visibility layer that remains cloud-agnostic.
That is its real differentiator:
In distributed architectures, that makes it possible to detect issues that purely cloud-native perspectives often fragment:
How Predictive Monitoring Reduces Risk in Multicloud
The biggest benefit of predictive monitoring in multicloud environments is not simply “detecting more things.”
It is reducing operational uncertainty.
It achieves this by:
In practice, the results usually appear in three dimensions.
Reduced Downtime
Detecting issues earlier enables teams to respond earlier.
That reduces both full outages and windows of functional degradation.
Better User Experience
When issues are contained before critical flows collapse, users experience less disruption.
Greater Operational Control
Predictive monitoring does not eliminate multicloud complexity, but it significantly reduces operational uncertainty.
And that matters enormously:
In multicloud, architecture cannot always be simplified. But operations can be improved with better signals.
Conclusion
The more clouds you use, the more interactions exist.
And the more interactions exist, the more potential failure points emerge.
That is the true challenge of multicloud monitoring.
It is not enough to have more dashboards or more data. In fact, more data without context can make the problem worse.
What truly matters is understanding the system’s global behavior and anticipating when an interaction begins to degrade.
That is the key message:
More clouds create more risk if visibility remains fragmented.
More signals do not create more control if nobody correlates what matters.
And more tools do not automatically create more resilience if each one only observes a small part of the system.
That is why predictive monitoring becomes a critical layer in distributed infrastructures.
Not because it replaces everything else, but because it helps teams see early what traditional monitoring usually understands too late.