Choosing a monitoring tool is no longer a purely technical decision. In modern architectures—where systems are distributed, workflows depend on multiple services, and the impact of a degradation is measured in revenue, churn, and reputation—the key question is no longer “Is the system up?”, but:
Can I anticipate problems before they affect the business?
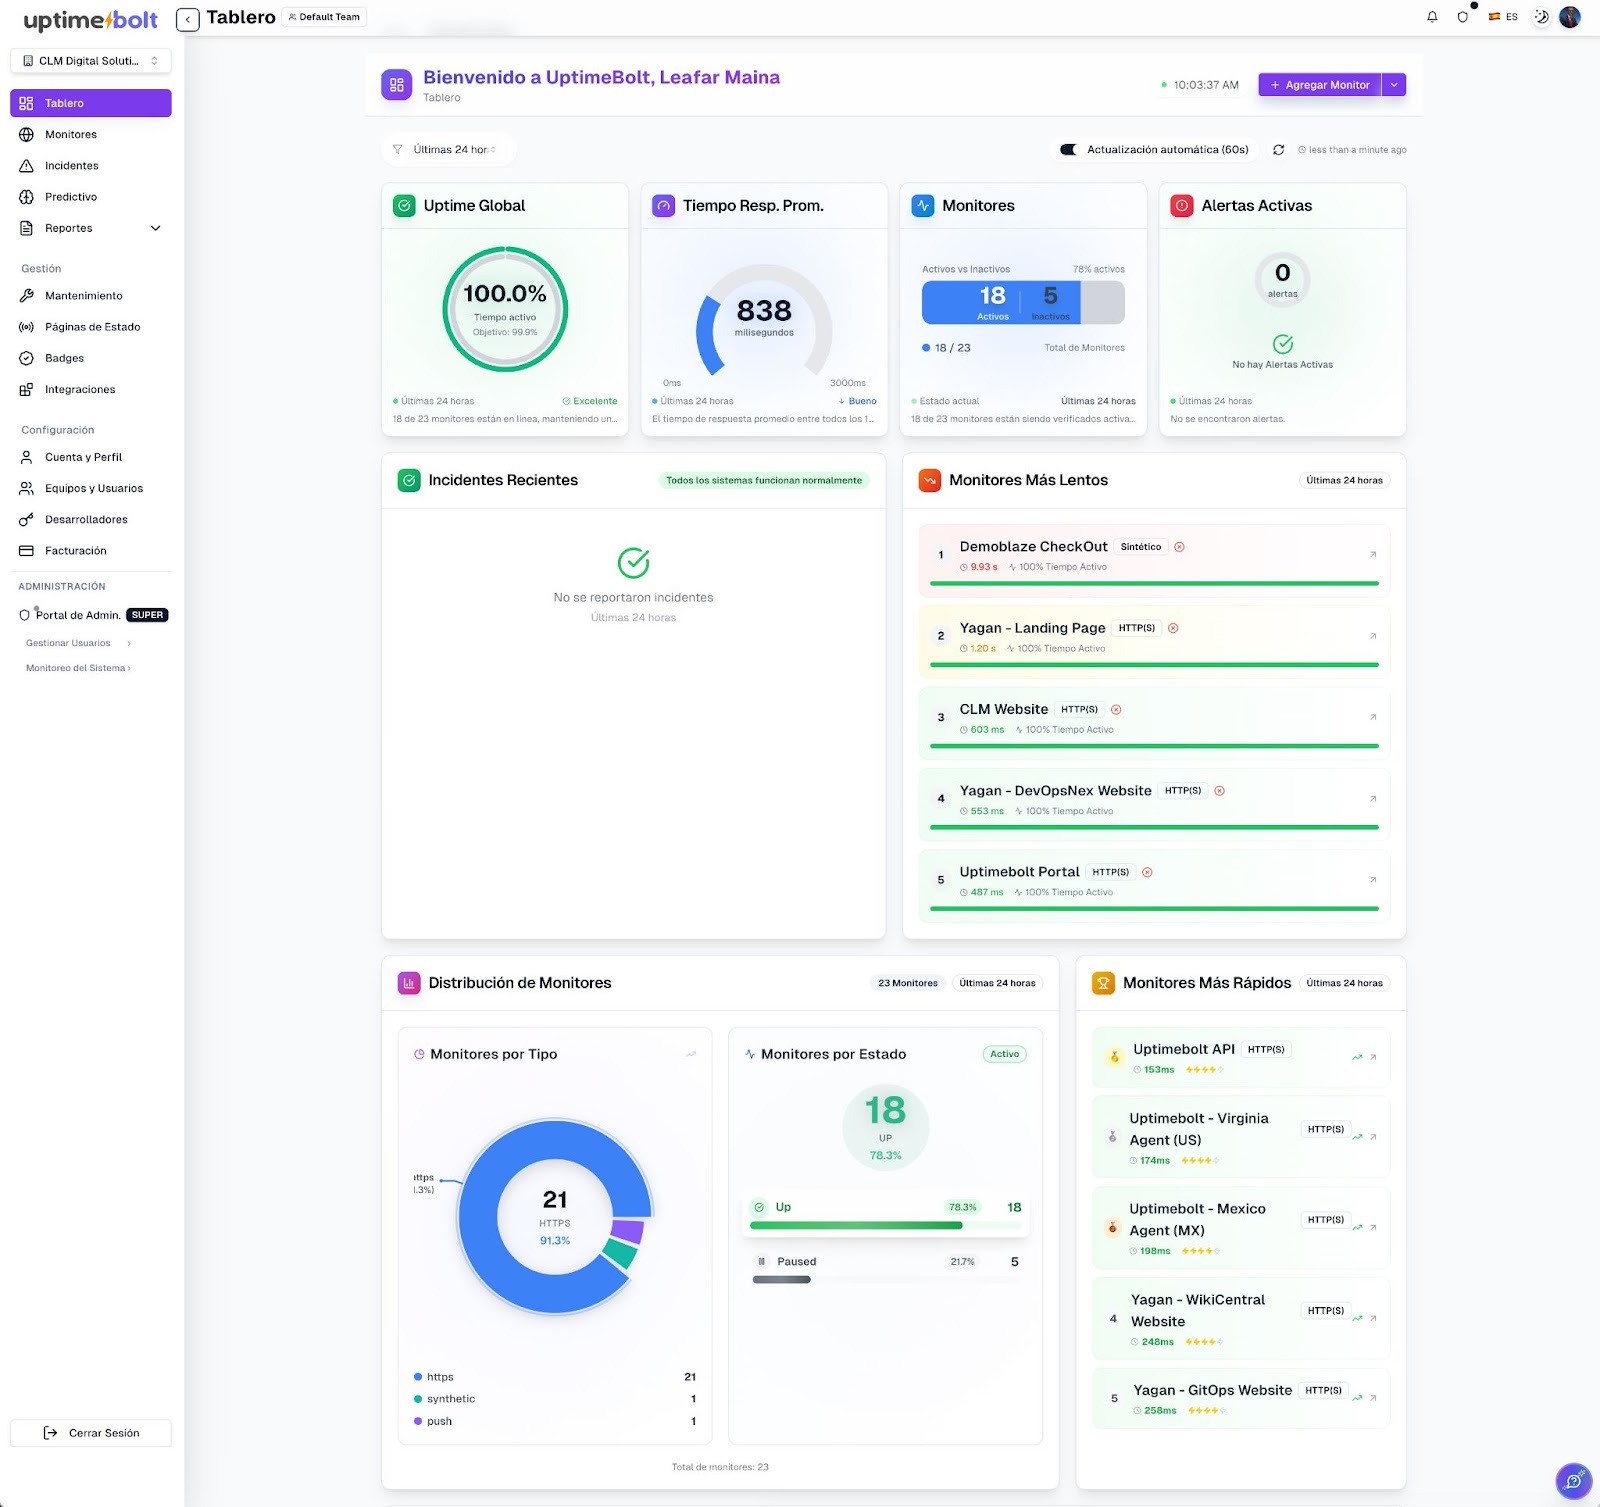
In this context, the market offers everything from simple uptime tools to enterprise observability platforms. UptimeBolt was created in a different part of the spectrum: as an AI-powered monitoring platform focused on early detection, predictive analysis, and real MTTR reduction.
This article compares UptimeBolt with well-known tools such as UptimeRobot, Better Stack, Pingdom, Site24x7, Sematext, and major players like Datadog and New Relic, analyzing strengths, limitations, and—most importantly—when each approach actually makes sense.
Most traditional monitoring tools were born in a much simpler world:
- Monolithic infrastructures
- Fewer external dependencies
- More predictable traffic patterns
That’s why their core logic is still reactive:
- Static thresholds
- Alerts only after something has already failed
- Manual post-incident analysis
Today, this model does not scale. The most costly failures are no longer total outages, but silent degradations, intermittent errors, gradual latency increases, or internal processes that stop running without generating visible errors.
This is where AI applied to monitoring stops being a “nice to have” and becomes a competitive advantage.
Before diving deeper, let’s group the tools by approach:
- UptimeRobot
- Pingdom
- Better Stack
- Site24x7
- Sematext (basic layer)
Each group solves different problems, and comparing them without context often leads to confusion.
These tools share a similar philosophy: check whether something responds or not.
- Easy to configure
- Low cost
- Ideal for simple websites or small projects
- Clear alerts for obvious outages
- Based on simple synthetic checks
- Little or no contextual analysis
- Unable to detect complex degradations
- Heavy reliance on static thresholds
- Manual investigation after incidents
In modern environments—e-commerce, fintech, SaaS—these tools usually alert too late, when the user impact is already visible.
👉 Conclusion: useful for basic uptime, insufficient for real reliability.
Sematext offers more depth than basic uptime tools, combining logs, metrics, and synthetic monitoring.
- Good balance between cost and functionality
- Reasonable observability for technical teams
- Flexible for certain use cases
- Mostly reactive analysis
- Correlation depends heavily on the user
- No strong focus on prediction or automated root cause analysis
Sematext is a solid step up from basic uptime monitoring, but it still requires significant human effort to generate real, actionable insights.
Datadog and New Relic are undeniably world-class platforms. They provide:
- Deep observability
- Integration with almost any stack
- Metrics, logs, traces, RUM, and APM
- Full system visibility
- Extreme flexibility
- Mature ecosystem
That same power often comes with underestimated operational costs:
- Very steep learning curve
- Complex configuration
- Costs that scale quickly
- High alert noise without strong governance
- AI is usually assistive, not core
Many organizations discover they have too much data and too few actionable insights. The platform is powerful, but not inherently predictive by design.
👉 Datadog and New Relic are excellent if you have:
- Large teams
- A significant budget
- Time and expertise to operate the platform
UptimeBolt does not try to compete on “volume of data,” but on quality of decisions.
From the very first onboarding steps, the focus is clear: AI applied to monitoring as the core of the product, not as an add-on.
- AI-based anomaly detection
- For example, while a static threshold in Datadog may only alert when latency exceeds 500 ms, UptimeBolt’s AI can detect an anomalous increase from 150 ms to 250 ms in a checkout flow—enough to predict a failure within the next two hours—because it deviates from historical behavior.
- Predictive incident analysis (30 minutes to 48 hours ahead)
- Automated reasoning for root cause analysis
- Full end-to-end (E2E) flow coverage
- Multilanguage and multi-tenant platform
- Clear focus on MTTR reduction
While other tools ask:
“What broke?”
UptimeBolt asks:
“What is starting to behave abnormally, and what will fail if we don’t act?”
In addition, unlike enterprise platforms where pricing scales with data volume (logs, metrics, traces), UptimeBolt offers a predictable pricing model, focused on the operational value generated by prevention—not on how much data you ingest.
- Basic tools: detect outages
- Datadog / New Relic: detect many signals, but require heavy tuning
- UptimeBolt: detects anomalies before incidents occur
- Basic tools: manual
- Enterprise platforms: semi-manual
- UptimeBolt: AI-assisted with automatic correlation
- Basic tools: high
- Enterprise platforms: very high without governance
- UptimeBolt: intelligent prioritization
- Basic tools: immediate but limited
- Enterprise platforms: long
- UptimeBolt: fast and focused
- Basic tools: technical uptime
- Enterprise platforms: technical observability
- UptimeBolt: operational reliability + revenue impact
- UptimeRobot / Pingdom → simple projects
- Sematext → intermediate observability needs
- Datadog / New Relic → organizations with large teams
- UptimeBolt → modern teams that want to anticipate issues, not react to them
Modern monitoring is no longer about knowing when something is down—it’s about preventing it from going down.
UptimeBolt positions itself clearly: less noise, less reaction, more prevention.
In a market saturated with dashboards, UptimeBolt focuses on operational intelligence. For CTOs, SREs, and e-commerce leaders, that difference is not technical—it’s strategic.
Choosing a monitoring tool is no longer a purely technical decision. In modern architectures—where systems are distributed, workflows depend on multiple services, and the impact of a degradation is measured in revenue, churn, and reputation—the key question is no longer “Is the system up?”, but:
Can I anticipate problems before they affect the business?
In this context, the market offers everything from simple uptime tools to enterprise observability platforms. UptimeBolt was created in a different part of the spectrum: as an AI-powered monitoring platform focused on early detection, predictive analysis, and real MTTR reduction.
This article compares UptimeBolt with well-known tools such as UptimeRobot, Better Stack, Pingdom, Site24x7, Sematext, and major players like Datadog and New Relic, analyzing strengths, limitations, and—most importantly—when each approach actually makes sense.
The underlying problem: reactive monitoring in increasingly complex systems
Most traditional monitoring tools were born in a much simpler world:
That’s why their core logic is still reactive:
Today, this model does not scale. The most costly failures are no longer total outages, but silent degradations, intermittent errors, gradual latency increases, or internal processes that stop running without generating visible errors.
This is where AI applied to monitoring stops being a “nice to have” and becomes a competitive advantage.
High-level overview of the compared tools
Before diving deeper, let’s group the tools by approach:
Uptime and basic monitoring tools
Enterprise observability platforms
Predictive monitoring with AI
Each group solves different problems, and comparing them without context often leads to confusion.
UptimeRobot, Pingdom, Better Stack, Site24x7: simple but limited
These tools share a similar philosophy: check whether something responds or not.
Strengths
Key limitations
In modern environments—e-commerce, fintech, SaaS—these tools usually alert too late, when the user impact is already visible.
👉 Conclusion: useful for basic uptime, insufficient for real reliability.
Sematext: an interesting middle ground
Sematext offers more depth than basic uptime tools, combining logs, metrics, and synthetic monitoring.
Where it adds value
Where it falls short compared to UptimeBolt
Sematext is a solid step up from basic uptime monitoring, but it still requires significant human effort to generate real, actionable insights.
Datadog and New Relic: power and complexity
Datadog and New Relic are undeniably world-class platforms. They provide:
Strengths
Weaknesses
That same power often comes with underestimated operational costs:
Many organizations discover they have too much data and too few actionable insights. The platform is powerful, but not inherently predictive by design.
👉 Datadog and New Relic are excellent if you have:
UptimeBolt: a fundamentally different approach
UptimeBolt does not try to compete on “volume of data,” but on quality of decisions.
From the very first onboarding steps, the focus is clear: AI applied to monitoring as the core of the product, not as an add-on.
Key strengths (SWOT perspective)
Core differentiator
While other tools ask:
UptimeBolt asks:
In addition, unlike enterprise platforms where pricing scales with data volume (logs, metrics, traces), UptimeBolt offers a predictable pricing model, focused on the operational value generated by prevention—not on how much data you ingest.
Direct comparison across key dimensions
1. Incident detection
2. Root cause analysis
3. Alert noise
4. Time to value
5. Business focus
Who each tool is best for
Conclusion: it’s not uptime, it’s predictive resilience
Modern monitoring is no longer about knowing when something is down—it’s about preventing it from going down.
UptimeBolt positions itself clearly: less noise, less reaction, more prevention.
In a market saturated with dashboards, UptimeBolt focuses on operational intelligence. For CTOs, SREs, and e-commerce leaders, that difference is not technical—it’s strategic.