For years, many organizations have measured the health of their digital services with a simple metric: uptime. If the system is “up,” everything is fine. If it’s down, there’s a problem.
That model is no longer enough.
As organizations evolve toward distributed architectures—microservices, APIs, external integrations, and event-driven systems—the way service “health” should be defined and measured also changes. In this context, Service Level Objectives (SLOs) based solely on uptime are insufficient to reflect the system’s real complexity.
Today, a service can formally meet an availability SLO (returning 200 OK) and still be completely degraded from the end-user’s perspective. Technical availability no longer guarantees a functional experience or positive business impact.
A checkout that takes 8 seconds, an API returning incomplete data, or a login that fails intermittently may not trigger traditional alerts—but they destroy conversions, revenue, and trust.
The health of digital services is not just about availability, but a combination of:
- Real performance
- User experience
- Operational stability
- Functional consistency
- Business impact
In this article, we will build a more complete—and actionable—way to measure that health.
To understand service health, it helps to think in terms of three fundamental pillars:
It is the system’s ability to respond correctly to requests.
But here’s a common trap:
available does not mean useful.
An endpoint can return 200 OK and still deliver empty or incorrect data. This is where Functional Availability or Business Transaction Availability comes into play.
It’s not enough to respond—you must respond quickly.
From the user’s perspective:
- 1 second: friction begins
- 3 seconds: abandonment increases
- 5 seconds: direct impact on conversion
In critical systems, high percentiles (p95/p99) matter more than averages.
This refers to consistency of behavior over time.
An unstable system does not always fail completely, but it:
- Produces intermittent errors
- Shows variable latency
- Degrades under load
This is especially dangerous because it’s hard to detect with traditional monitoring.
The key is measuring jitter or latency standard deviation, which requires predictive monitoring.
The problem is not the lack of metrics—it’s measuring the wrong ones or interpreting them incorrectly.
Relevant indicators:
- % of successful requests (real SLI)
- Success of critical flows (login, checkout, payment)
- Functional errors (not just HTTP errors)
Example:
- 99.9% uptime → looks healthy
- But 2% checkout failures → direct revenue impact
Key indicators:
- p95 and p99 latency
- End-to-end (E2E) flow time
- Time in critical steps
Example:
- Average: 300 ms
- p95: 2.5 s
The system appears fast, but 5% of users have a poor experience.
Important indicators:
- Latency variability
- Frequency of intermittent errors
- Behavior under load
Example:
- API stable in testing
- In production, latency spikes every 10 minutes
This is degradation, not failure.
This is where most teams lose visibility.
Not all errors are obvious—in fact, the most dangerous ones aren’t.
- An API returns 200 OK but the body is empty
- Login works but takes 8 seconds
- Payment is processed but not visually confirmed
- A microservice returns inconsistent data
- An external integration responds slowly but doesn’t fail
From a technical perspective, the system is “working.”
From the user’s perspective, it’s broken.
Before an outage, there are almost always signals:
- Latency rises from 200 ms → 400 ms → 900 ms
- Errors increase from 0.1% → 0.5% → 1%
- Requests start failing only in certain scenarios
- p95 response time exceeds the 1.5s SLO, but the service is still “up” (SLA)
These degradations:
- Don’t cross static thresholds
- Don’t trigger immediate alerts
- But directly impact the business
A 1% failure rate may seem small, but:
- 100,000 requests → 1,000 failures
- If they are payments → direct revenue loss
- If they are logins → loss of active users
These issues consume error budget without teams even noticing.
To operationalize this, here’s a traffic-light model teams can implement, based on an SLO/Health Scorecard framework that enables error budget management tied to user experience.
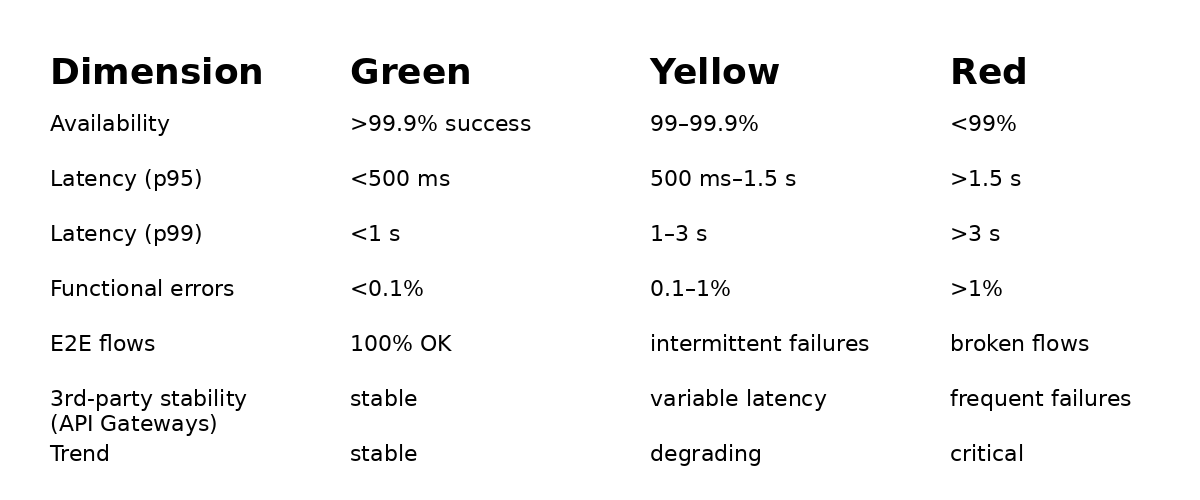
- Evaluate each dimension daily
- Do not rely on a single metric
- Prioritize what impacts the business
- Visualize health as a system, not as isolated KPIs
This type of scorecard enables real conversations between:
- Engineering
- Product
- Business
Traditional monitoring observes parts of the system.
The problem is that users don’t experience parts.
They experience complete flows.
- Full login
- Navigation
- Checkout
- Payment
- Confirmation
- Broken integrations
- Frontend errors
- Session issues
- Failures in intermediate steps
Example:
- API responds OK
- Database OK
- But the full flow fails
Only E2E detects it.
Because it measures the only thing that matters:
Did the user achieve their goal?
Metrics show the present.
AI enables anticipating the future.
- Detects anomalies before thresholds
- Identifies invisible patterns
- Correlates signals automatically
- Prioritizes what matters
Without AI:
With AI:
- Detects pattern change from 300 ms → 500 ms
- Predicts saturation in 2 hours
- Reduces MTTD
- Reduces MTTR
- Prevents incidents before they occur
This transforms health from reactive to preventive.
UptimeBolt doesn’t aim to replace observability—it makes it more actionable.
It acts as a layer that connects:
- Monitoring
- Real experience (E2E)
- AI-driven prediction
- Monitor complete critical flows
- Detect anomalies in real time
- Analyze historical behavior
- Anticipate incidents
- Reduce alert noise
The system hasn’t failed, but:
- “Process Payment” latency increases by 15%
- Only in certain regions
- Only at specific times
Traditional monitoring does not alert. UptimeBolt does—because it detects deviation.
- Problem identified before impact
- Early action
- Reduced revenue loss
- Better SLOs
Digital service health is not measured by uptime.
It is measured by the system’s ability to:
- Respond correctly
- Maintain consistent performance
- Adapt without degrading
- Anticipate failures
A healthy system:
- Is stable
- Is fast
- Is predictable
Organizations that understand this stop reacting to incidents and start operating with control.
And in an environment where every second of degradation directly impacts revenue, that difference is not technical.
It is strategic.
If you want to measure and improve the real health of your services—beyond uptime—we invite you to get started with UptimeBolt through a free trial.
For years, many organizations have measured the health of their digital services with a simple metric: uptime. If the system is “up,” everything is fine. If it’s down, there’s a problem.
That model is no longer enough.
As organizations evolve toward distributed architectures—microservices, APIs, external integrations, and event-driven systems—the way service “health” should be defined and measured also changes. In this context, Service Level Objectives (SLOs) based solely on uptime are insufficient to reflect the system’s real complexity.
Today, a service can formally meet an availability SLO (returning 200 OK) and still be completely degraded from the end-user’s perspective. Technical availability no longer guarantees a functional experience or positive business impact.
A checkout that takes 8 seconds, an API returning incomplete data, or a login that fails intermittently may not trigger traditional alerts—but they destroy conversions, revenue, and trust.
The health of digital services is not just about availability, but a combination of:
In this article, we will build a more complete—and actionable—way to measure that health.
The pillars of digital health: availability, performance, and stability
To understand service health, it helps to think in terms of three fundamental pillars:
1. Availability
It is the system’s ability to respond correctly to requests.
But here’s a common trap:
available does not mean useful.
An endpoint can return 200 OK and still deliver empty or incorrect data. This is where Functional Availability or Business Transaction Availability comes into play.
2. Performance
It’s not enough to respond—you must respond quickly.
From the user’s perspective:
In critical systems, high percentiles (p95/p99) matter more than averages.
3. Stability
This refers to consistency of behavior over time.
An unstable system does not always fail completely, but it:
This is especially dangerous because it’s hard to detect with traditional monitoring.
The key is measuring jitter or latency standard deviation, which requires predictive monitoring.
How to measure each pillar and what indicators really matter
The problem is not the lack of metrics—it’s measuring the wrong ones or interpreting them incorrectly.
Real availability (not theoretical)
Relevant indicators:
Example:
User-centric performance
Key indicators:
Example:
The system appears fast, but 5% of users have a poor experience.
Operational stability
Important indicators:
Example:
This is degradation, not failure.
Silent errors and degradation: the risk of technical false positives
This is where most teams lose visibility.
Not all errors are obvious—in fact, the most dangerous ones aren’t.
Real examples of silent errors
From a technical perspective, the system is “working.”
From the user’s perspective, it’s broken.
Progressive degradation
Before an outage, there are almost always signals:
These degradations:
Real impact
A 1% failure rate may seem small, but:
These issues consume error budget without teams even noticing.
Practical framework: digital service health scorecard
To operationalize this, here’s a traffic-light model teams can implement, based on an SLO/Health Scorecard framework that enables error budget management tied to user experience.
Health dimensions
How to use it
This type of scorecard enables real conversations between:
The importance of E2E monitoring to validate real experience
Traditional monitoring observes parts of the system.
The problem is that users don’t experience parts.
They experience complete flows.
What E2E monitoring validates
What it detects that other approaches miss
Example:
Only E2E detects it.
Why it’s critical for real health
Because it measures the only thing that matters:
Did the user achieve their goal?
How AI complements traditional metrics with prediction
Metrics show the present.
AI enables anticipating the future.
What AI does in this context
Practical example
Without AI:
With AI:
Impact on service health
This transforms health from reactive to preventive.
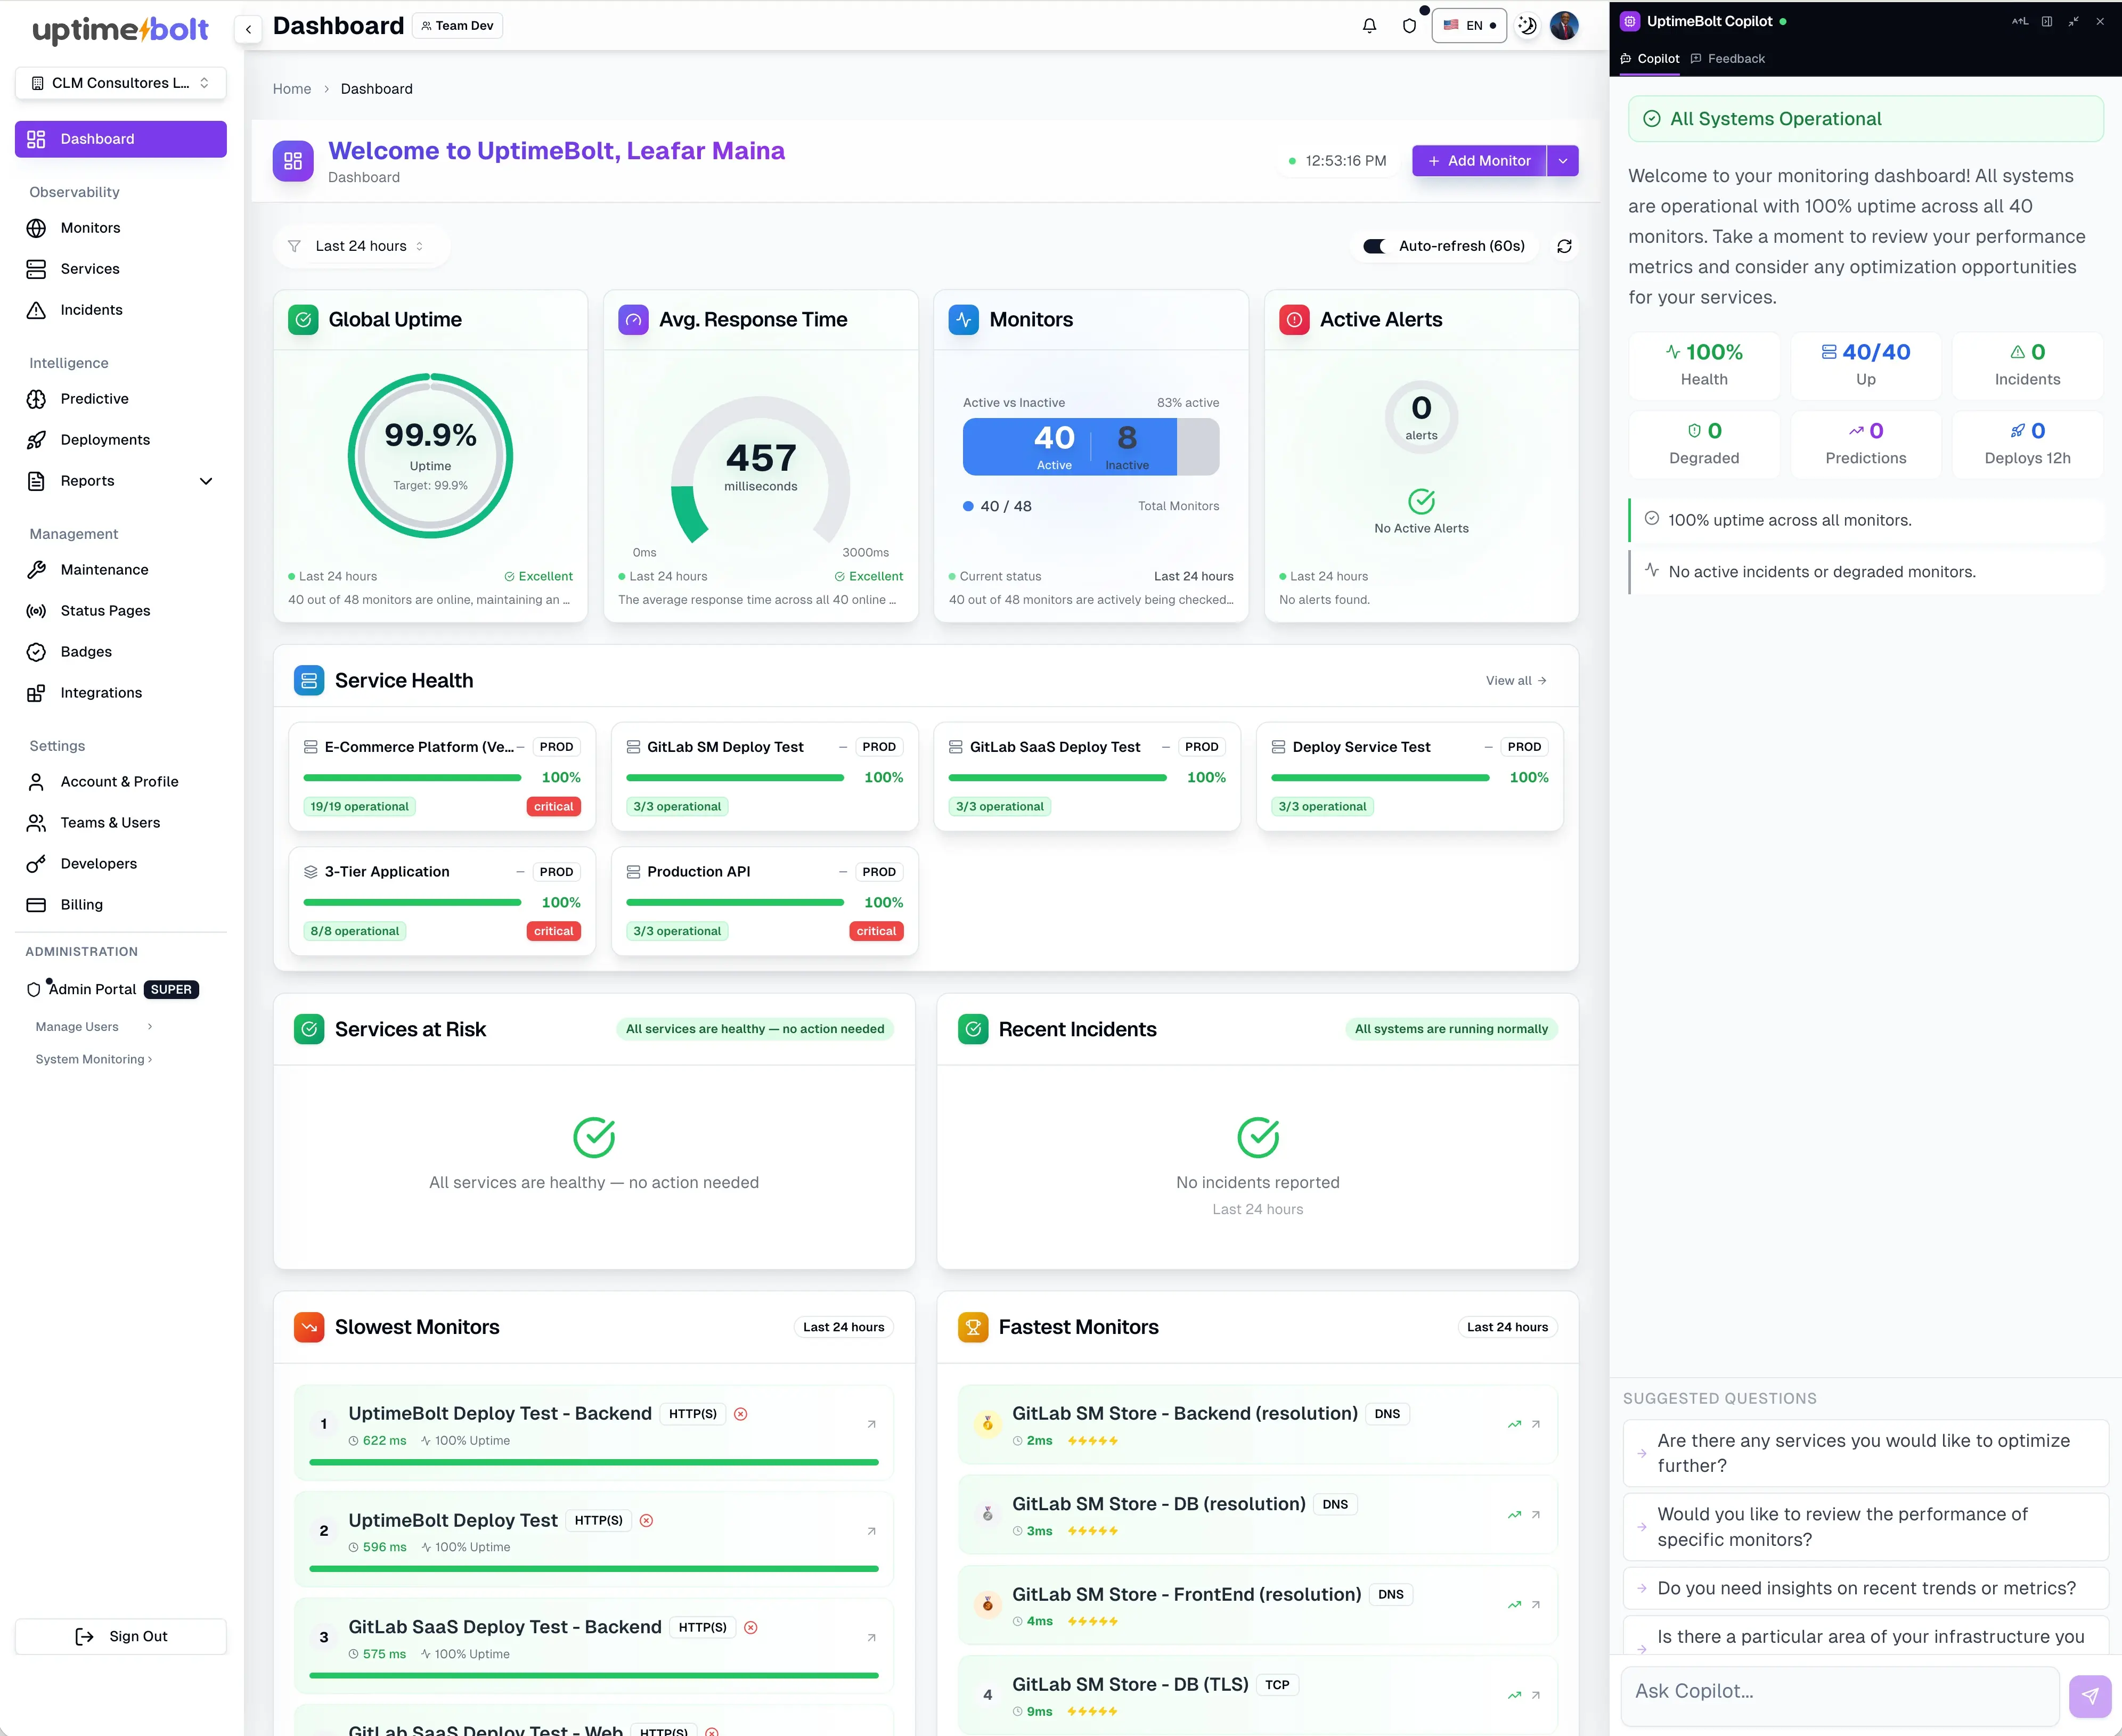
How UptimeBolt consolidates health, stability, and prediction in a single panel
UptimeBolt doesn’t aim to replace observability—it makes it more actionable.
It acts as a layer that connects:
What it enables
Concrete example
The system hasn’t failed, but:
Traditional monitoring does not alert. UptimeBolt does—because it detects deviation.
Result
Conclusion: a healthy service is stable, fast, and predictable
Digital service health is not measured by uptime.
It is measured by the system’s ability to:
A healthy system:
Organizations that understand this stop reacting to incidents and start operating with control.
And in an environment where every second of degradation directly impacts revenue, that difference is not technical.
It is strategic.
If you want to measure and improve the real health of your services—beyond uptime—we invite you to get started with UptimeBolt through a free trial.